Phase / Phase singularities
See the tutorial for how to easily create a phase map.
Select the map creation target area before executing.

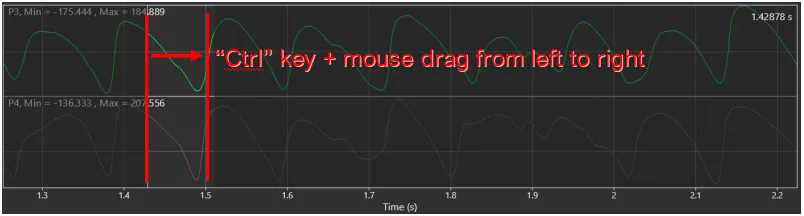
Specify some time range. Hold down “Ctrl” key and drag mouse from left to right on waveform to specify range.
Select [Phase map...] from the [Analyze] menu.

A phase map can be created like below. Black hollow circles on the image indicate phase singularities.
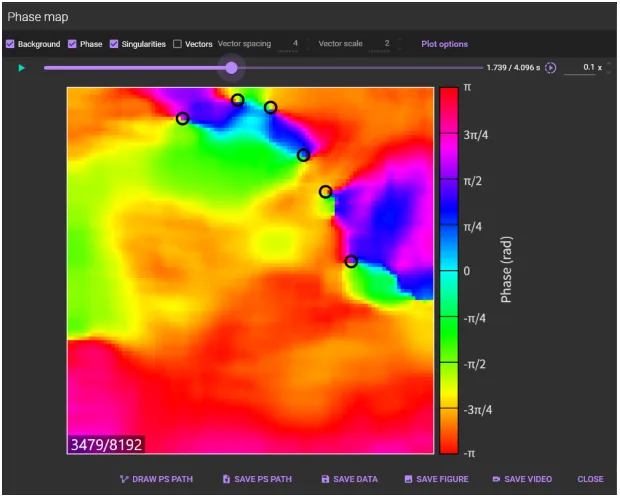

(1) Background
Select whether to display a background image or not.
(2) Phase
Select whether or not to display phase map
(3) Singularities
Select whether or not to display phase singularities (black hollow circles).

(4) Vectors
Select whether or not to display vectors.
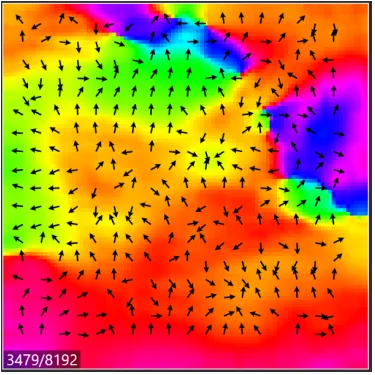
(5) Vector spacing
Specifies vector spacing. This setting can be changed when “ (4) Vectors” is ON.
(6) Vector scale
Specifies the scale of the vector. This setting can be changed when “ (4) Vectors” is ON.
(7) Plot options
Click to open plot option screen. Color map (palette) can also be changed.

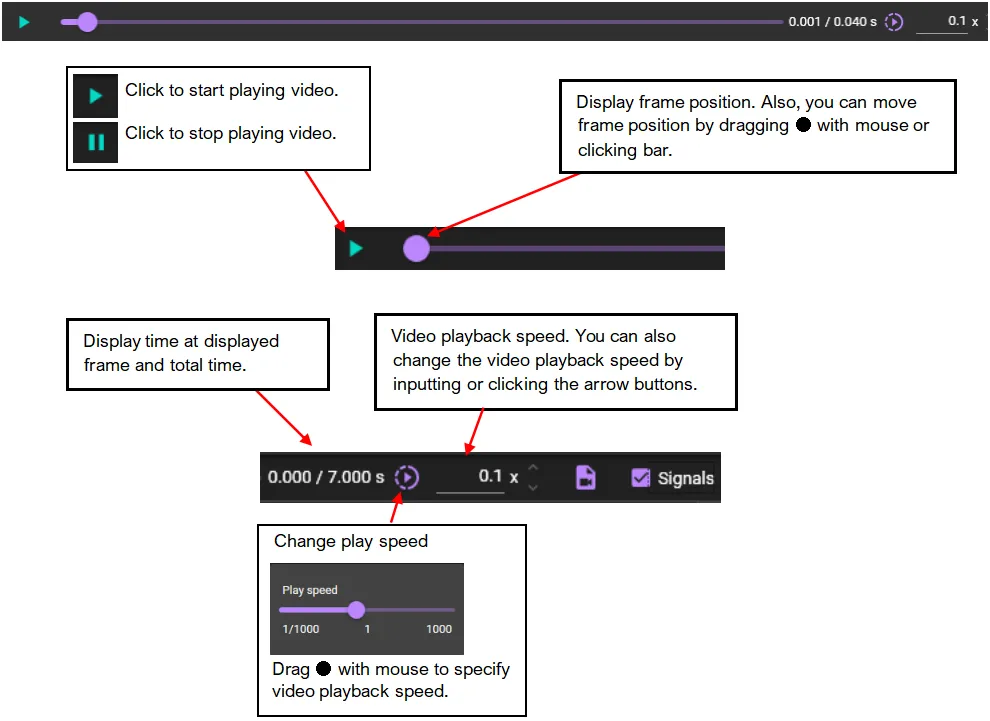
(8) Video playback
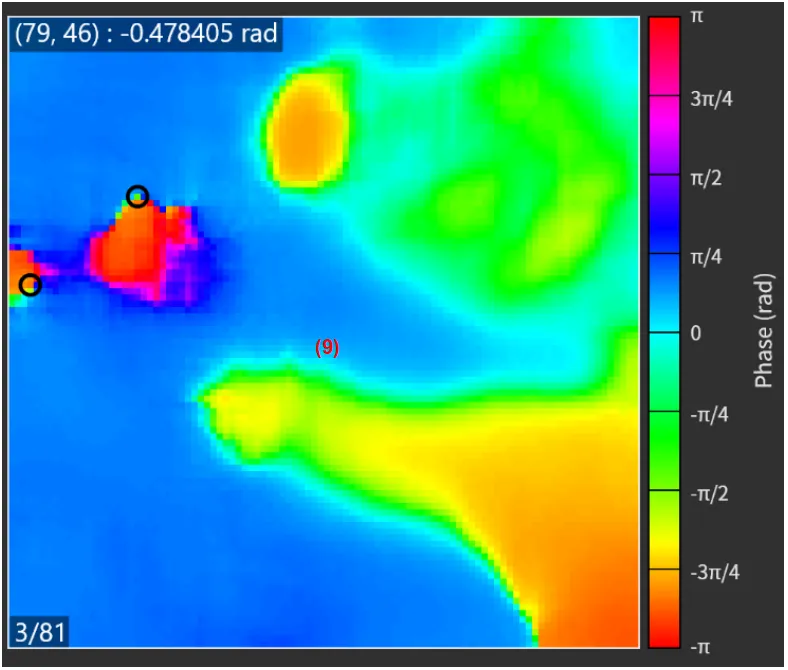
(9) Map
A phase map is shown here.
The following mouse operations are possible.
| Operation | Description |
|---|---|
| Scroll mouse wheel | Enlarge/reduce image size. |
| Mouse move over image | Coordinates and radian are displayed on the top left of the map. |
| Right click | “Background”, “Phase”, “Singularities”, “Vectors” can be selected. |

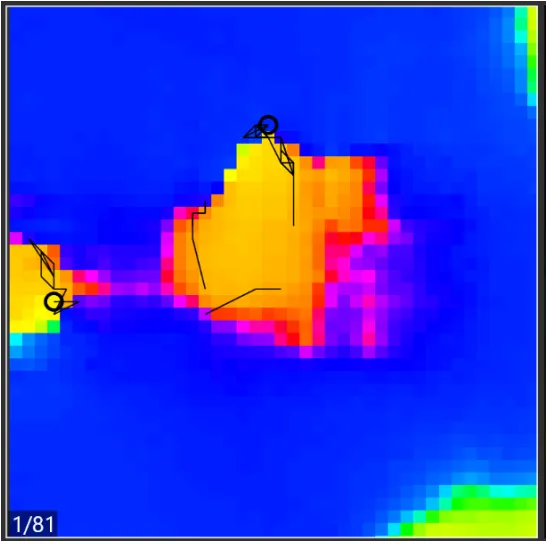
(10) DRAW PS PATH
Click to draw PS trajectory.
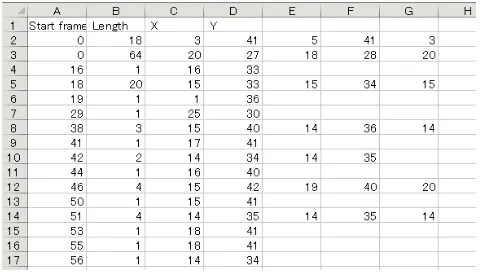
(11) SAVE PS PATH
Save data that shows PS trajectories to a csv file like below.
(12) SAVE DATA
Save data to a binary file (*.dat).
(13) SAVE FIGURE
Click to open “Figure editor”. See “Save image (figure editor)” for details.
(14) SAVE VIDEO
Save data to a video file (*.avi).
(15) CLOSE
Close this dialog.