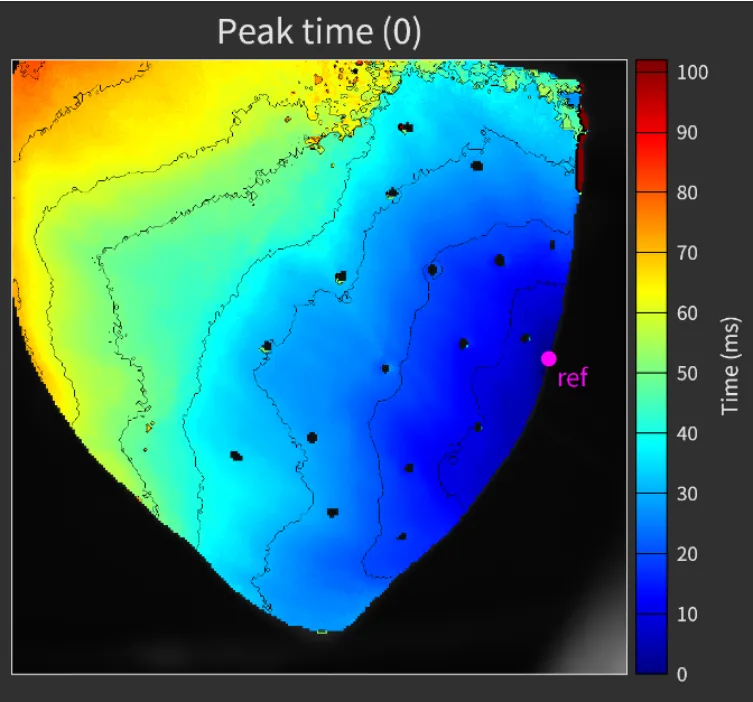
Peak time
- Select [Time domain analysis] from the [Analyze] menu.

- Select “Mx” or “Rx” from “Mask”.
- Select “Peak time” from “Output type”.

- Hold “Ctrl” key and drag mouse pointer to right to select time range of waveform. Then, click “CREATE MAPS”.

- Select “Ref. point” and then, click “Min”. If a point position on the image is not correct, drag a point to other position.

- Click “Auto” to automatically set display range. Change “Min” and “Max”, if needed.

- Select color map from “Pallete” and select “Black (or Colored)” from “Contour lines”. Adjust “Step”, if needed.
