Dominant frequency
Select the map creation target area before executing.

Select [Dominant frequency map...] from the [analyze] menu.

A dominant frequency map can be created like below.
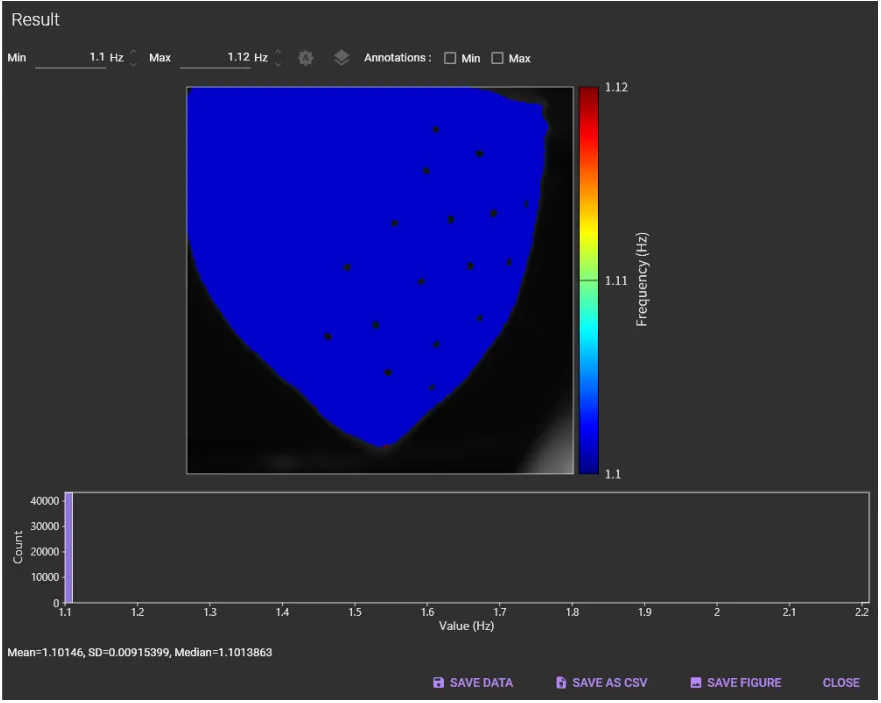

(1) Min
Specifies the minimum frequency to colorize on the map.
(2) Max
Specifies the maximum frequency to colorize on the map.
(3) Auto adjustment
Click to set min and max to optimal values.
(4) Plot options
Click to open plot option screen. Color map (palette) can also be changed.

(5) Annotations: Min
Annotate minimum value points.
(6) Annotations: Max
Annotate maximum value points.

(7) Map
A map created for each peak is shown here.
The following mouse operations are possible.
| Operation | Description |
|---|---|
| Scroll mouse wheel | Enlarge/reduce image size. |
| Mouse move over image | Coordinates, velocity and degrees are displayed on the top left of the map. |

(8) Histogram
Displays a histogram showing the relationship between values (frequency) and number of pixels. Scrolling mouse wheel enlarges/reduces size of histogram.

(9) SAVE DATA
Save data to a binary file (*.dat).
(10) SAVE CSV
Output the numerical values of the displayed map to a CSV file.
(11) SAVE FIGURE
Click to open “Figure editor”. See “Save image (figure editor)” for details.
(12) CLOSE
Close this dialog.