Wave map
Select [Wave map...] from the [Analyze] menu.

A wave map can be created like below. The average waveform of multiple pixels is displayed on the background image.
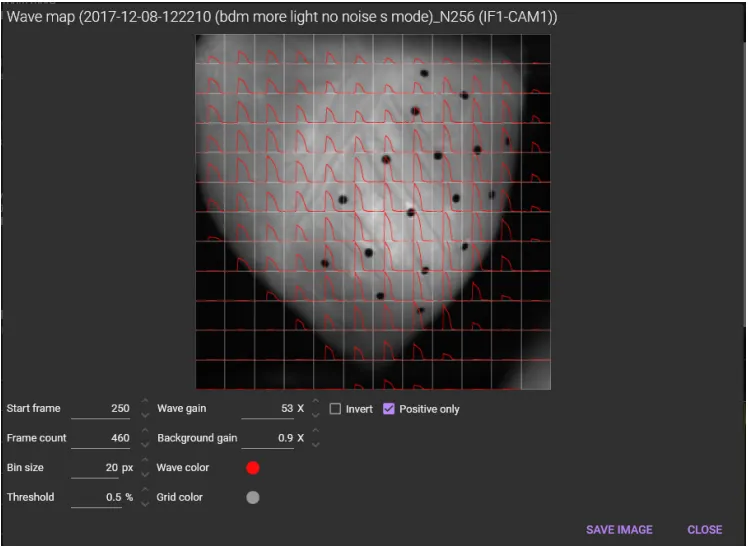

(1) Map
A wave map is shown here.
The following mouse operation is possible.
| Operation | Description |
|---|---|
| Scroll mouse wheel | Enlarge/reduce horizontal waveform size. |
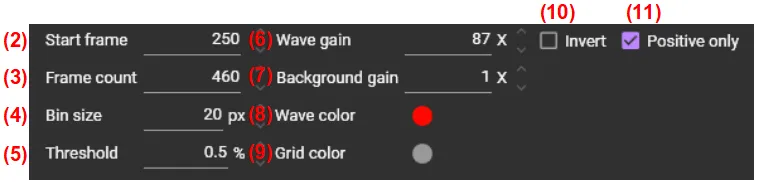
(2) Start frame
Set the start frame number.
(3) Frame count
Set the number of frames
(4) Bin size
Set the number of pixels to bin. The smaller the number, the greater the number of divisions on the image.
(5) Threshold
Set percent change relative to baseline (F/F0).
(6) Wave gain
Set the waveform vertical scale.
(7) Background gain
Set the background image gain.
(8) Wave color
Set the wave color.

(9) Grid color
Set the grid color.

(10) Invert
Inverts the polarity of the waveform.
(11) Positive only
Show only positive values.

(12) SAVE IMAGE
Save wave map in a image file (png / svg).
(13) CLOSE
Close this window.