Save image (figure editor)
Right-click on the image and click "save image", or click the icon ![]() ,
, ![]() to display the following dialog.
to display the following dialog.
On this dialog, you can make settings for saving high resolution image data in “png” / “svg” format, which is suitable for making figures for scientific papers.
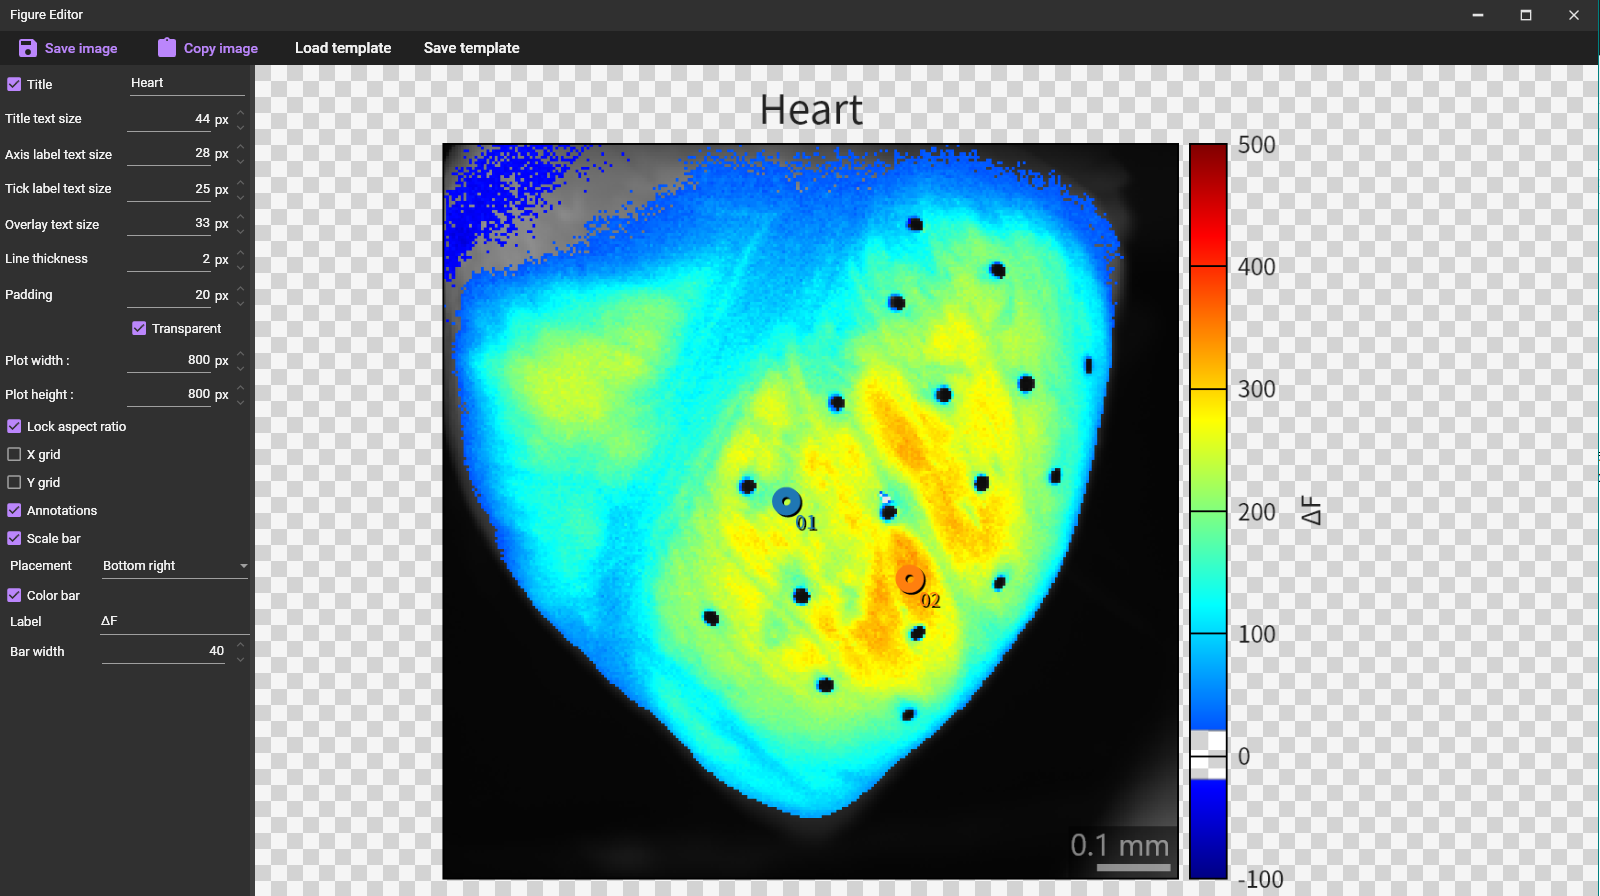

(1) Save image
Save the displayed image in png/svg format.
(2) Copy image to clipboard
Copy the displayed image to the clipboard.
(3) Load template / (4) Save template
The following menu will appear.
Click the settings (number and pixel numbers) in the (3) to load the setting and reflect them on the dialog.
Click number and pixel numbers in the (4) to save the current settings.

(5) Title
When the check box is turned on, the title will be displayed above image. Change contents in text box if you want to change title.
(6) Title text size
Change the size of the text displayed at the top of the image.
(7) Axis label text size
Change the text size of the axis labels displayed to the right of the color bar.
(8) Tick label text size
Change the text size of the tick labels displayed to the right of the color bar
(9) Overlay text size
Change the text size of the scale bar displayed on the image. Scale bar is only visible when field of view is set.
(10) Line thickness
Change the border thickness of the image and color bar.
(11) Padding
Change the padding (blank space between outer frame and image).
(12) Transparent background
When the check box is turned on, background image becomes transparent. When the check box is turned off, background image becomes white.
(13) Plot width
Set the width resolution of the image file to be saved.
(14) Plot height
Set the height resolution of the image file to be saved.
(15) Lock aspect ratio
When the check box is turned on, the resolution is adjusted so that the aspect ratio is maintained. When the check box is turn off, the aspect ratio can be changed freely.
(16) X grid
Sets whether to show or hide horizontal lines when displaying waveform graphs. This doesn't work when displaying images.
(17) Y grid
Sets whether to show or hide vertical lines when displaying waveform graphs. This doesn't work when displaying images.
(18) Annotations
Sets the visibility of points, lines, and ROIs on the image.
(19) Scale bar
Set whether to show or hide the scale bar.
(20) Placement
Specifies the display position of the scale bar.
(21) Color bar
Set whether to show or hide the color bar.
(22) Label
Enter the characters to be displayed on the right side of the color bar.
(23) Bar width
Specifies the width of the color bar.