Main window
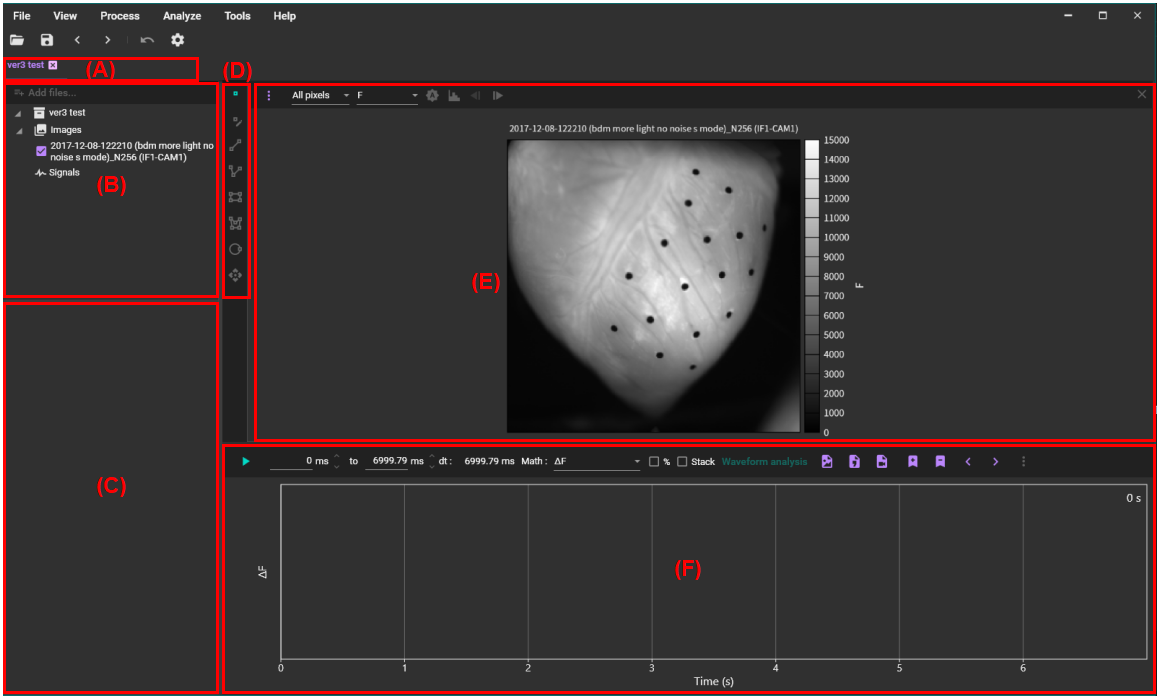
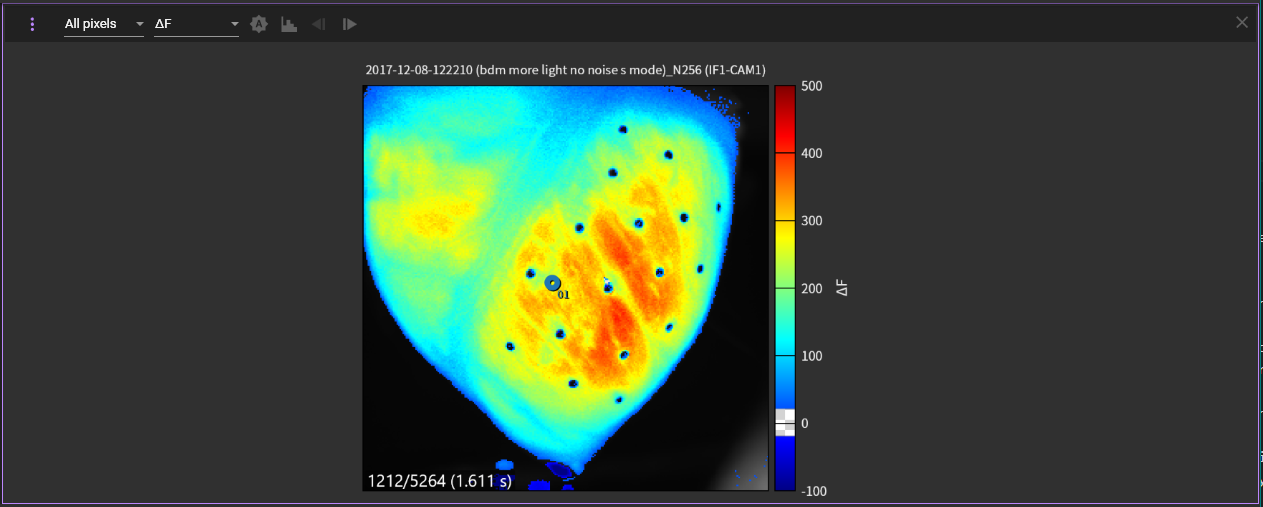
When data is open, the following window will be displayed.
Direct link
- (A) Tabs
- (B) View and select dataset, data, signals
- (C) Data information display / setting for images and signals
- (D) Specify Point, Line, ROI
- (E) Image display
- (F) Wave display
(A) Tabs
![]()
Acquired data and setting window ("App settings") are displayed in tabs. Click tab name to open that window. You can change display order by dragging the tab name left and right.
To close tab, click the x icon or select [File]-[Close]. To close all tabs at once, select [File]-[Close all].
(B) View and select dataset, data, signals
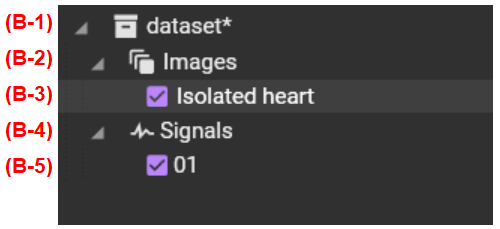
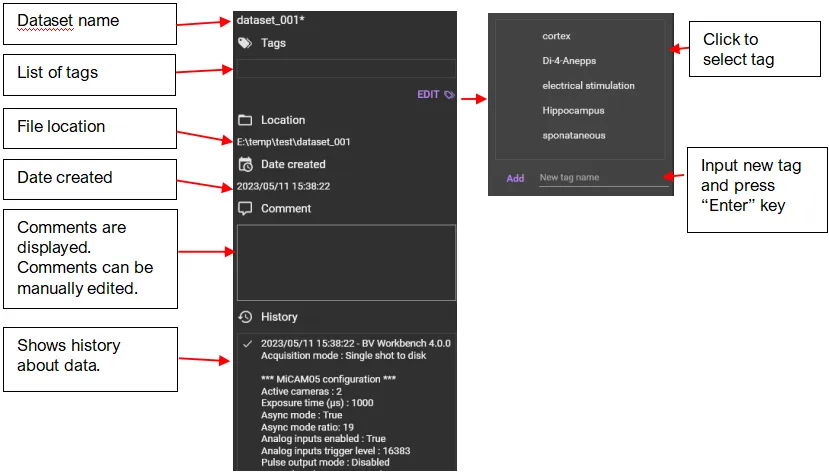
(B-1) Dataset name
Displays dataset name. If there is a change such as adding data to the dataset, an asterisk (*) will be displayed to the right of the name.
Left-click to display the following dialog in (C) .
Right-click to display the following menu.
| Menu | Description |
|---|---|
| Time slice | Save different data with specified time range. See “Create subset” for more details. |
| Rename | Rename dataset. |
| Open in explorer | Display the directory (folder) where the dataset is stored using Windows explorer. |
(B-2) Images
The list of data contained in this dataset is displayed in the hierarchy below.
(B-3) List of data
The list of data is displayed. Turn off the checkbox to hide the data.
Left-click to display the following screen in (C) .
Right-click to display the following menu.
| Menu | Description |
|---|---|
| Copy file path | Copy file path for data to clipboard |
| Remove | Remove selected data from dataset. |
| Rename | Rename selected data. |
| Properties | Open “Properties” dialog. See “Properties” for details. |
(B-4) Signals
Displays a list of specified points and their current values.
Left-click to display the following screen in (C) .
Right-click to display the following menu.
| Menu | Description |
|---|---|
| Add... | Imports waveform data in .dat, .csv, and *.tsv formats. |
| Remove point/area signals | Remove all displayed waveforms. |
(B-5) List of signals
The list of signals is displayed. Turn off the check box to hide waveform.
Left-click to display the following screen in (C) .
Right-click to display the following menu.
| Menu | Description |
|---|---|
| Firing rate plot | Show firing rate per time. See “Firing rate”. |
| Frequency spectrum | Display frequency analysis results using Fourier Transform. See “Frequency spectrum” |
| Spctrogram | Display time-frequency analysis results using Short-time Fourier transform. See “Spetrogram”. |
| Phase plot | Display phase analysis results using Hilbert transform. See “Phase plot”. |
| Remove | Remove the selected signal. |
| Properties | Display numeric data about the selected point. |
(C) Data information display / setting for images and signals
Please refer to each item of (B) .
(D) Point, Line, ROI
| Icon | Description |
|---|---|
| Add point | Click on image to add points. Multiple points can be specified. Right-click on a point to display a menu. See “Specifying a point” for details. |
| Move vertex | Move vertexes of point, line, rectangle and polygon to change position and shape of ROI. |
| Add line | Click two points on image to specify a straight line. You can specify multiple straight lines. Right-click on line to display a menu where you can set scale, data analysis and so on. See “Line drawing”for details. |
| Add polyline | Specify polyline by clicking multiple points on image. Right-click in the middle of making polyline to stop making polyline. You can specify multiple polygonal lines. Right-click on polyline to display a menu where you can select data analysis, copy polyline position, rename it, or delete polyline. See “Specifying a polyline” for details. |
| Add rectangle | Click two points on image to specify rectangle. Right-click on rectangle to display a menu where you can set scale, select data analysis, copy polygon position, rename, and delete polygon. See “Specifying rectangle” for details. |
| Add polygon | Click multiple points on image to specify a polygon. You can complete the polygon by specifying the first and last points to overlap. Right-click on polygon to display a menu where you can plot time signal, copy polygon position, rename, and delete polygon. See “Specifying polygon” for details. |
| Add circle | Click two points on image to specify circle. Right-click on a point to display a menu. See “Specifying circle” for details. |
Move shape | Move shape (ROI) by dragging it with mouse. |
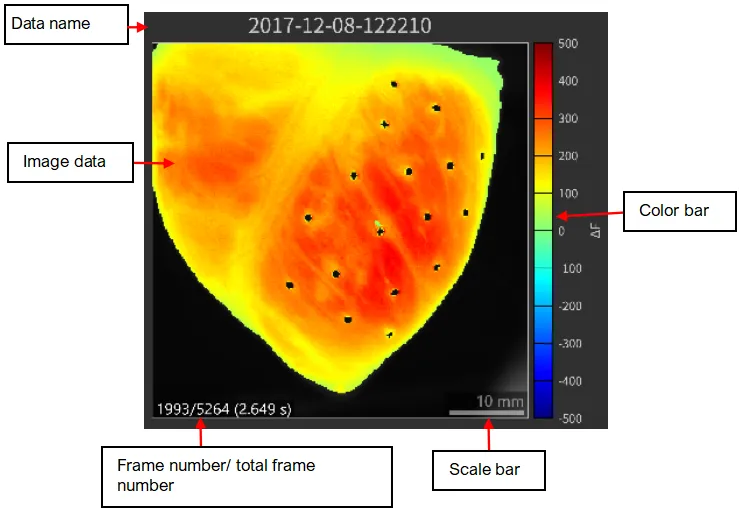
(E ) Image display
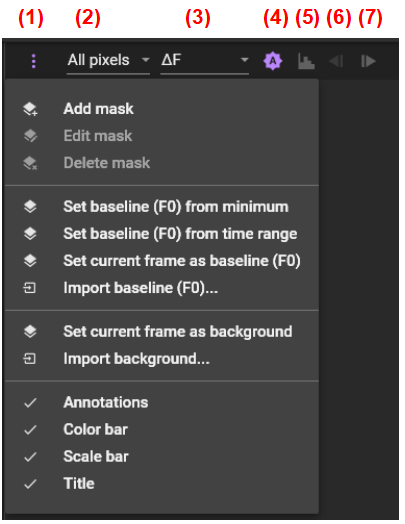
(E-1) Menu
[Add mask]
Specifies the area to be used for data analysis (mask) by specifying a threshold for image brightness.
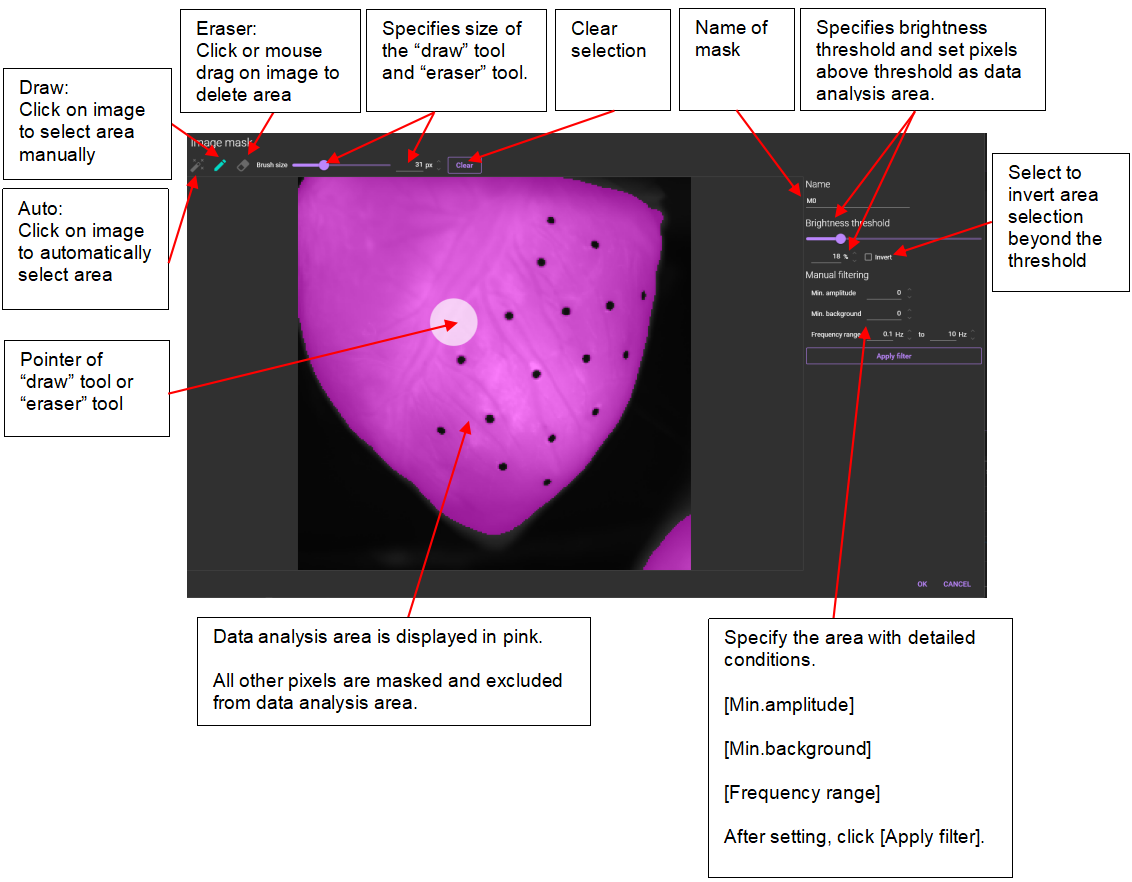
[Edit mask]
Edit the specified mask. This menu becomes selectable only when a mask name is specified from the [Image mask] list box on the right.
The same dialog as when [Add mask] is selected appears.

[Delete mask]
Delete the specified mask. This menu becomes selectable only when a mask name is specified from the [Image mask] list box on the right.

[Set baseline (F0) from minimum]
Set the baseline so that the minimum value in all pixels and all frames is 0.
[Set baseline (F0) from time range]
Sets the baseline so that the average value for the specified time range is 0.
You can specify the time range by dragging the mouse pointer to the right while clicking the ctrl key, or by setting the [Time range] at the top of the waveform.
[Set current frame as baseline (F0) ]
Sets the baseline so that the currently selected frame is 0.
[Import baseline (F0)...]
Select data (*.tif/*.raw). Use F0 values of the selected data as baselines.
[Set current frame as background]
Use the currently selected frame as the background image.
[Import background...]
Import an image file (*.bmp, *.jpg, *.jpeg, *.png, *.tif, *.tiff) and use that image file as the background image. The number of pixels in the image file to be imported must be the same as the number of pixels in the data.
[Annotations]
Sets visibility of points, lines, and ROIs on the image.
[Color bar]
Sets visibility of color bar.
[Scale bar]
Sets visibility of scale bar. A scale bar is displayed when field of view size is specified in the "Image sequence properties" dialog that opens by right-clicking on image.
[Title]
Sets visibility of title that is shown above image.
(E-2) All pixels / ROI /mask selection
Select the area for pseudo-color display and data analysis from “All pixels”, “roi (region)” , “Cx (circle)”, “Mx (mask)”.

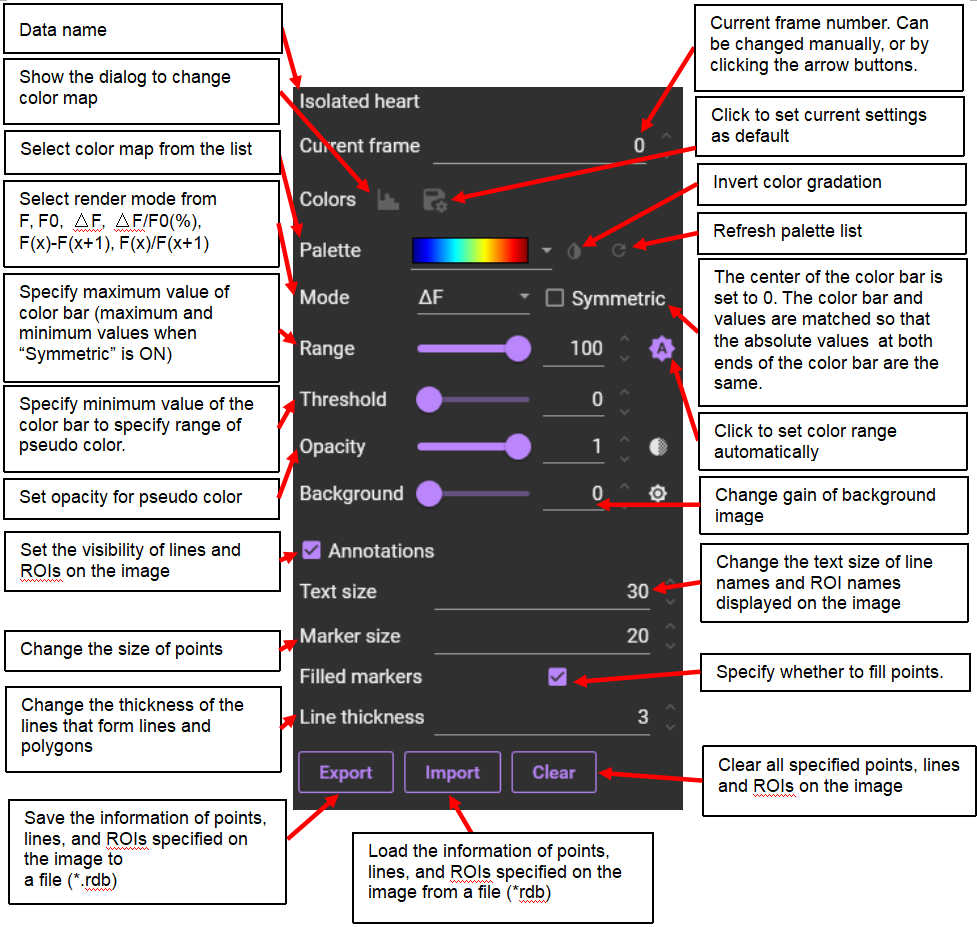
(E-3) Render mode
(E-4) Auto adjustment
Automatically set display range to optimum.
![]()
(E-5) Edit color map
Open color map editor. See Edit color map for details.
(E-6) Previous frame
Click to go to previous frame.
(E-7) Next frame
Click to go to next frame.
(E-8) Image display
The following mouse operations are possible.
| Operation | Description | ||
|---|---|---|---|
| Left click | When the “Add point” tool is selected, a waveform showing light intensity change of clicked point is displayed in “(G) wave display”. When line/polyline/rectangle/polygon/circle tool is selected, you can draw a line/polyline/rectangle/polygon/circle on image and perform various data analysis. | ||
| Mouse drag point | Move position of point. Waveform display in “(G) wave display” also changes accordingly. | ||
| Scroll mouse wheel | Enlarge or reduce image. | ||
| Right click | ROI | Paste regions | Paste point, line, polyline, rectangle, polygon, circle and mask to other data. |
| Copy regions | Copy positions of point, line, polyline, rectangle, polygon, circle and mask. | ||
| Clear regions | Clear point, line, polyline, rectangle, polygon, circle and mask from selected data. | ||
| Export regions | Export position information of point, line, polyline, rectangle, polygon, circle and mask to a file (*.rdb). | ||
| Import regions | Import position information of point, line, polyline, rectangle, polygon, circle and mask to a file (*.rdb). | ||
| Color map... | Open color map editor. See “Edit color map” for details. | ||
| Copy image | Copy image of selected data to clipboard. The image can be pasted to application like Word. | ||
| Save image... | Open “Figure editor” to save image. See “Save image (figure editor)” for details. | ||
| Export frame... | Save the selected frame as a 16bit grayscale tiff file. | ||
| Properties | Open “Properties” screen. See “ Properties” on for details. | ||
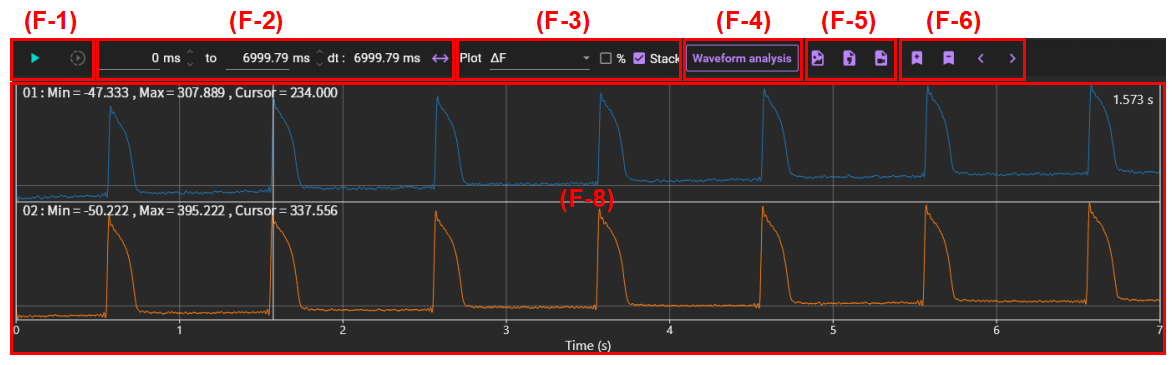
(F) Wave display
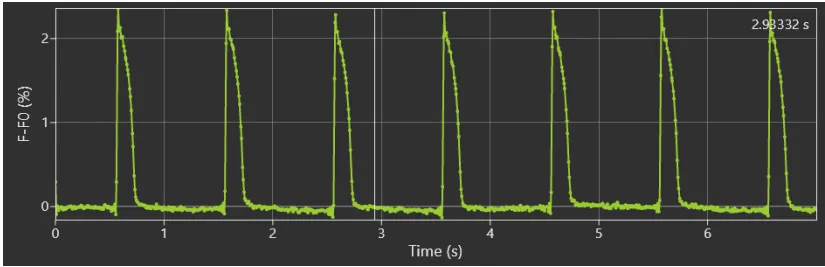
Click on image to display the following waveforms after “Add point” ![]() is selected.
is selected.
Light intensity change at clicked point is shown. Horizontal axis shows time (seconds) and vertical axis shows light intensity change (units can be changed).
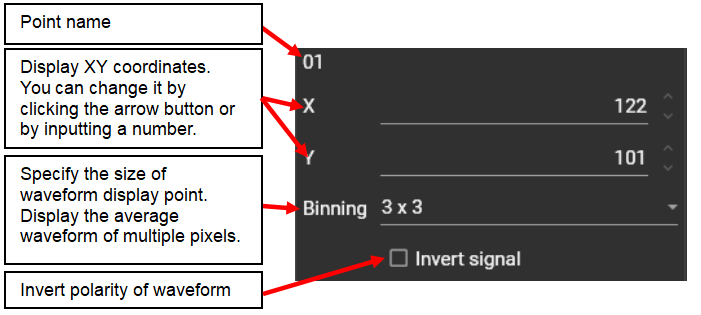
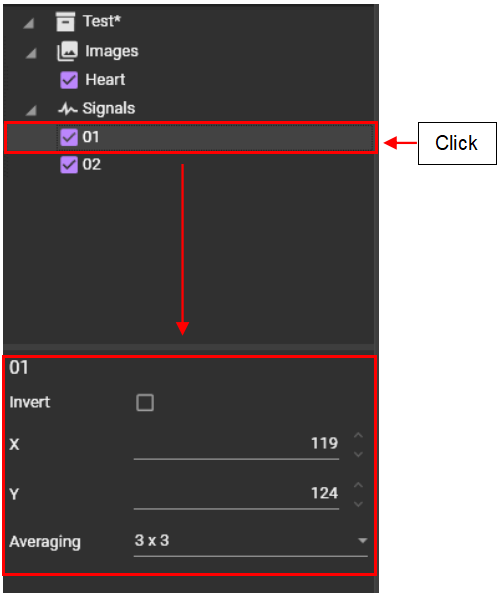
Click on a point name under “Signals” in the tree at the top left to view details of clicked point. See (B-6) List of signals for details.
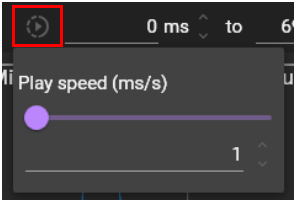
(F-1) Play video
Click to play video.
The video playback speed can be changed in the pop-up that appears when you click the button circled in red.
(F-2) Time range
Specify a time range. The specified time range is used for video playback and data analysis.
Start and end times can be specified manually or by clicking the arrow buttons.
![]()
Click to select time axis's current range.
![]()
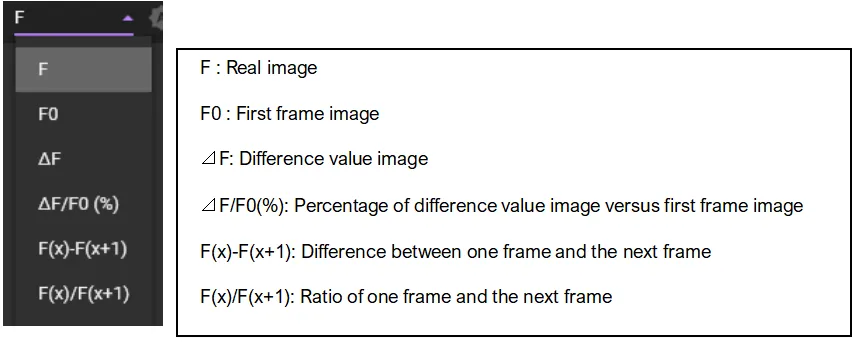
(F-3) Y-axis display method

[Plot]
Specify how to display the Y-axis values in the waveform display.
| Math | Description |
|---|---|
| F | Absolute value |
| ⊿F | Differential value ((Absolute value of each frame) - (Absolute value of first frame)) |
| dF/dt | First derivative of absolute value |
| dF2/dt2 | Second derivative of absolute value |
| d(⊿/F0)/dt | First derivative of differential value ratio |
[Percentage]
Display values in percent (percent change for ⊿F).
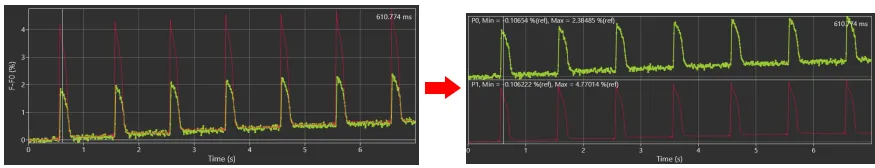
[Stack]
Display multiple waveforms stacked vertically.
(F-4) Waveform analysis
Click to open waveform analysis screen. See Waveform analysis for details.
(F-5) Save and export data

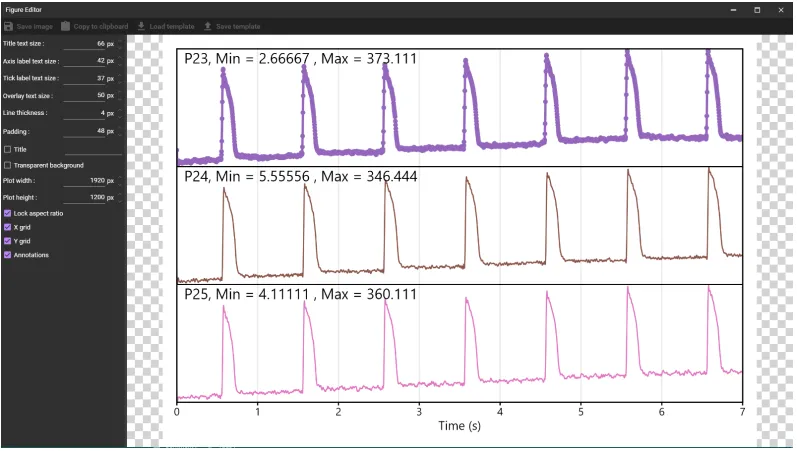
(a) Save image
Click to open “Figure editor”. See Save image (figure editor) for details.
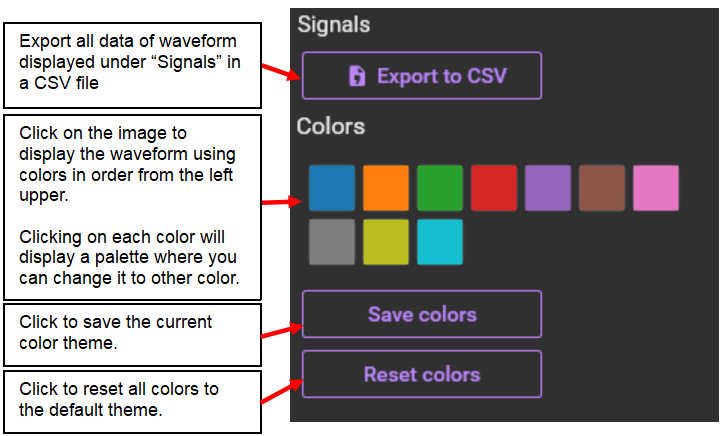
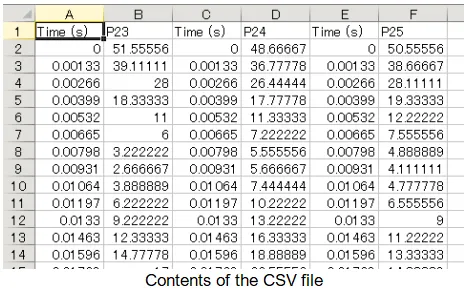
(b) Save chart values
Outputs time and values for waveform display to a CSV file.
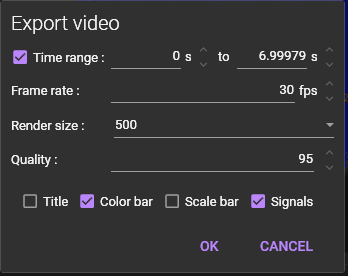
(c) Export video...
Export video data in AVI format.
(F-6) Marker
Add or remove time maker. Markers allow you to jump between multiple time positions.

(a) Add marker
Add marker to waveform. Multiple markers can be added.
(b) Remove marker
Removes the last specified marker.
(c) Previous marker
Go to previous marker.
(d) Next marker
Go to next marker.
(F-8) Waveform display
The following mouse operations are possible.
| Operation | Description |
|---|---|
| Click on waveform | Move frame position |
| Drag mouse pointer left or right on waveform | Move frame position |
| Hold “Ctrl” key and drag mouse pointer to right | Select time range of waveform. It is possible to create various maps and analyze various data based on the range selected here. You can select time range with “Time range” at top of waveform |
| Hold “Ctrl” key and drag mouse pointer to left | Deselect time range selection for waveform and select all ranges. |
| Scroll mouse wheel | Enlarge/reduce horizontal waveform size |
| Right click | A popup menu is displayed. Specify display range of X-axis/Y-axis and set display/hide of grid lines. |