Statistical values of signals
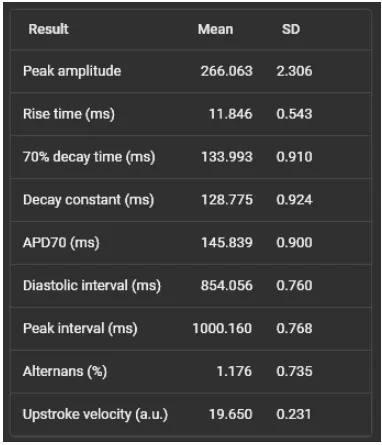
Mean value and standard deviation for multiple signals (peak waveforms) can be displayed for each point. The following parameters are displayed.
- Peak amplitude
- Rise time
- Decay time
- Decay constant
- APDxx
- BPM
- Diastolic interval
- Peak interval
- Alternans
- Upstroke velocity
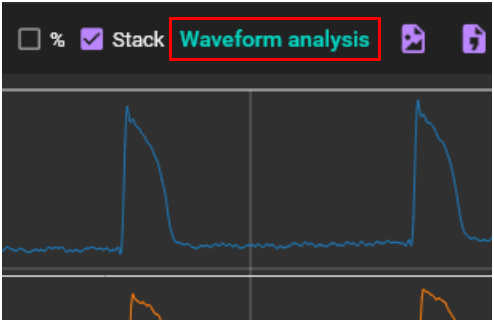
After clicking the image to display the waveform, click "waveform analysis" surrounded by a red frame.
The waveform analysis dialog is displayed.
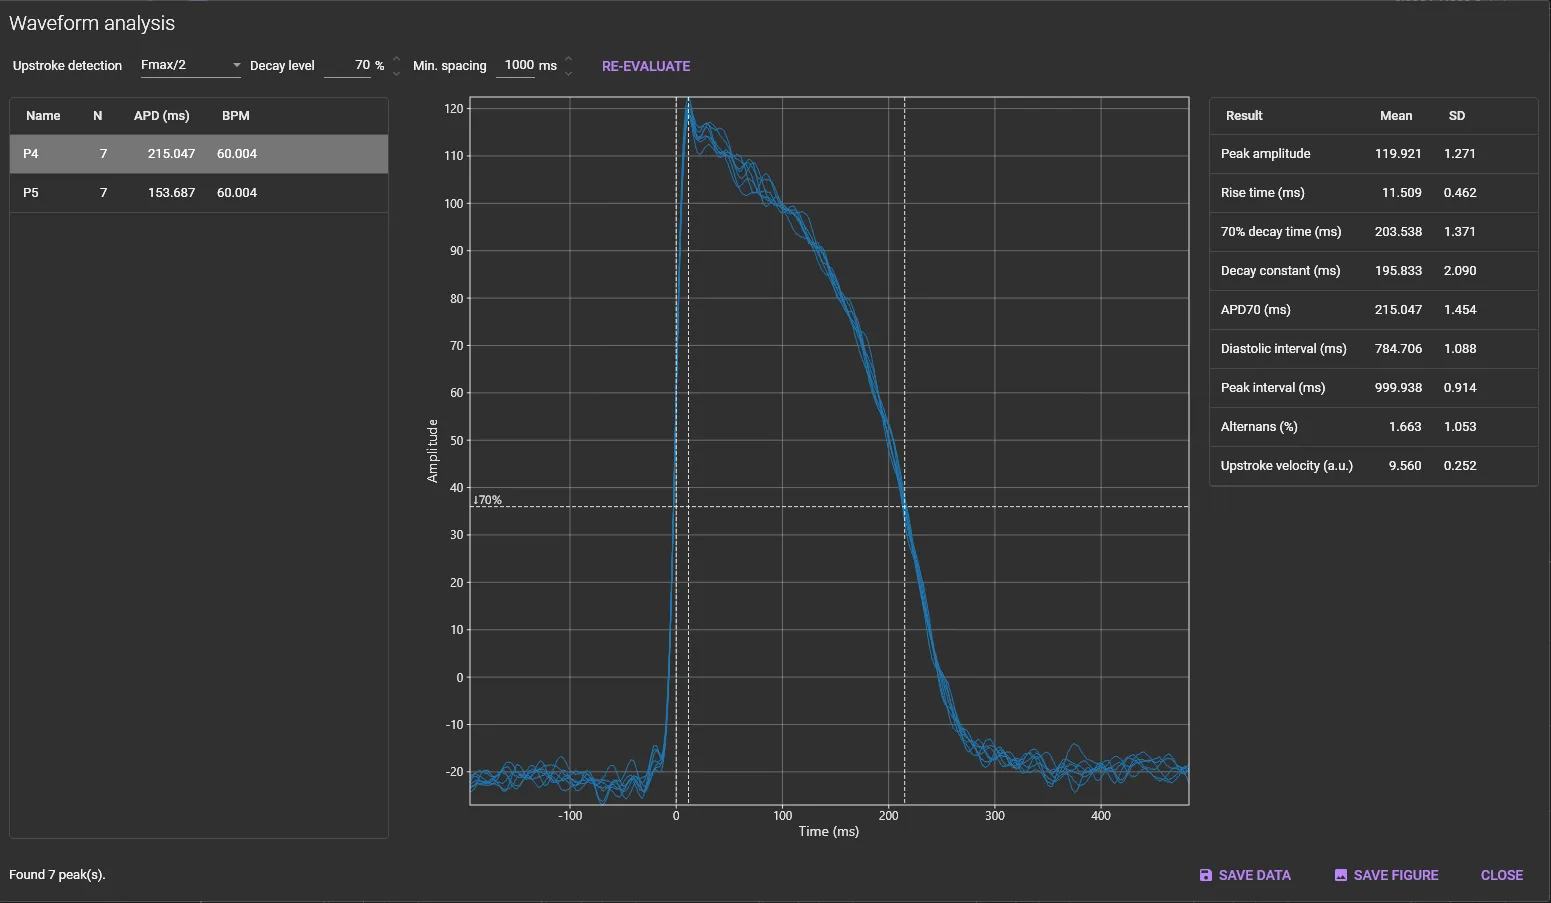

(1) Upstroke detection
Select detection method for activation time from “Fmax/2”, “Fmax” and “max(dF/dt)”.
(2) Decay level
Set recovery % from the peak to baseline.
(3) Min. Spacing
Minimum time span between two peaks.
(4) RE-EVALUATE
Click after changing (1) , (2) , and (3) . The waveform display below will change. Average APD and average BPM for each point are displayed.

(5) Name
Point name. Click to sort in ascending or descending order.
(6) N
Number of peaks. Click to sort in ascending or descending order.
(7) APD (ms)
Average APD for each point. Click to sort in ascending or descending order.
(8) BPM
Average BPM for each point. Click to sort in ascending or descending order.
The peaks at the selected points are displayed in an overlay.
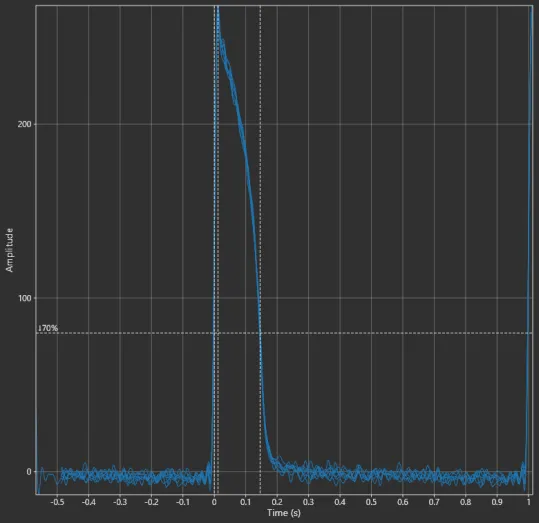
The following mouse operations are possible on the chart.
| Operation | Description |
|---|---|
| Scroll mouse wheel | Enlarge/reduce horizontal waveform size. |
| Right click | A popup menu is displayed. Specify display range of X-axis/Y-axis and set display/hide of grid lines. |
Displays “Mean” and “Standard deviation (SD)” for selected points.

(9) SAVE DATA
Outputs peak amplitudes, peak time, rise time, xx% decay time, decay constant, APDxx, diastolic interval, peak interval, alternans and upstroke velosity at selected points to a CSV file. Outputs values for each peak (not an average) at a selected point.
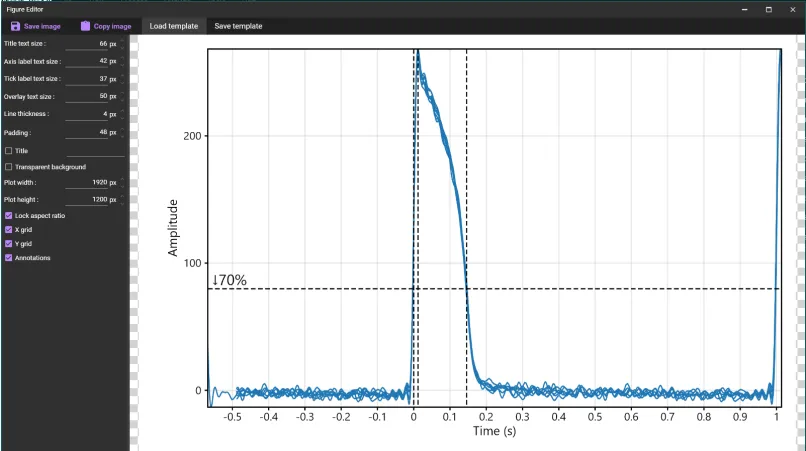
(10) SAVE FIGURE
Click to open “Figure editor”. See “Save image (figure editor)” for details.
(11) CLOSE
Click to close this dialog.