Spectrogram (time-frequency analysis)
Spectrograms are generated by the Short-time Fourier transform.
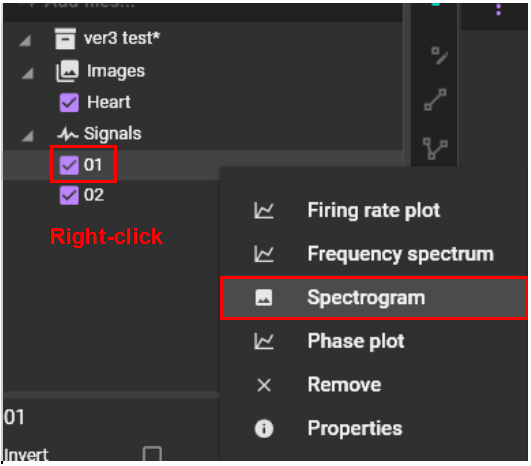
Right click on the signal name and select “Spectrogram".
Displays the following screen. Click “OK” to open analysis result of continuous wavelet transform.
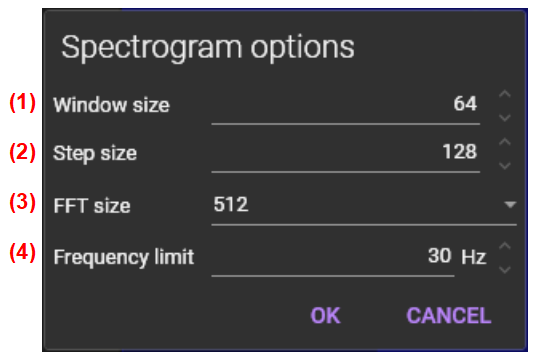
(1) Window size
Set number of samples per window.
(2) Step size
Set step size. When step size is less than windows size, window ovelaps.
(3) FFT size
Set FFT size. When window size is less than FFT size, data will be padded with zeros.
(4) Frequency limit
Set maximum frequency.
The following time-frequency map is displayed (X-axis: time (s), Y-axis: frequency (Hz)).
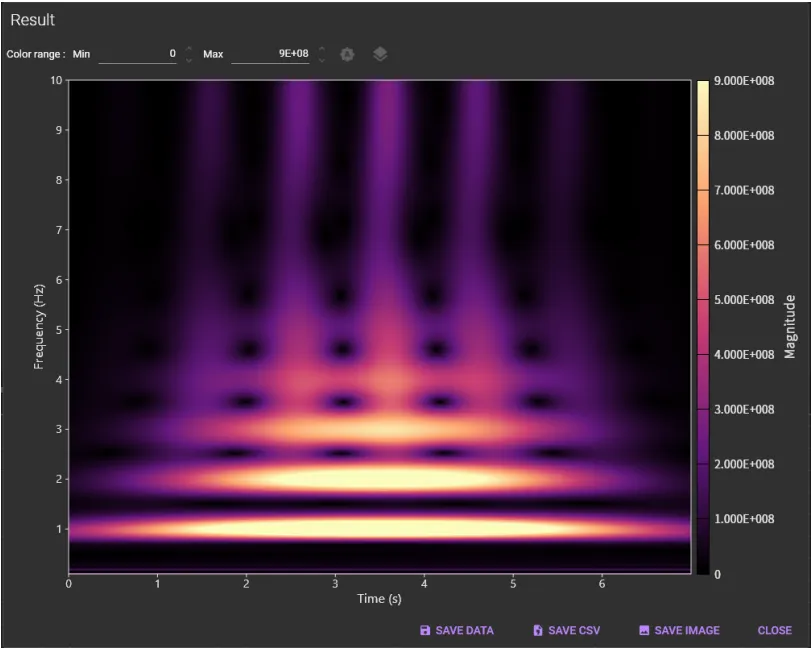
The following mouse operation is possible on the chart.
| Operation | Description |
|---|---|
| Scroll mouse wheel | Enlarge/reduce horizontal waveform size. |
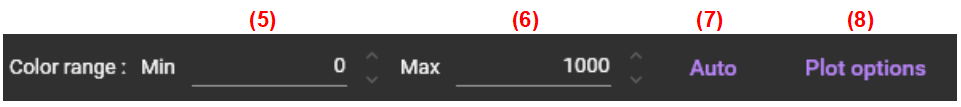
(5) Color range: Min
Specifies minimum magnitude to be colored.
(6) Color range: Max
Specifies maximum magnitude to be colored.
(7) Auto
Auto set display range
(8) Plot options
Click to open color map setting screen. Color map (palette) can be changed.

(9) SAVE VALUES
Export data to a binary file (*.dat).
(10) SAVE FIGURE
Save spectrogram in an image file. Click to open “Figure editor”. See “Save image (figure editor)” for details.
(11) CLOSE
Close this dialog.