Frequency spectrum (FFT analysis)
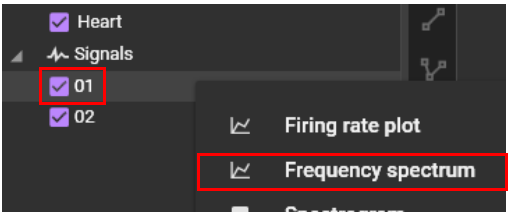
Right click on the signal name and select “Fourier Transform".
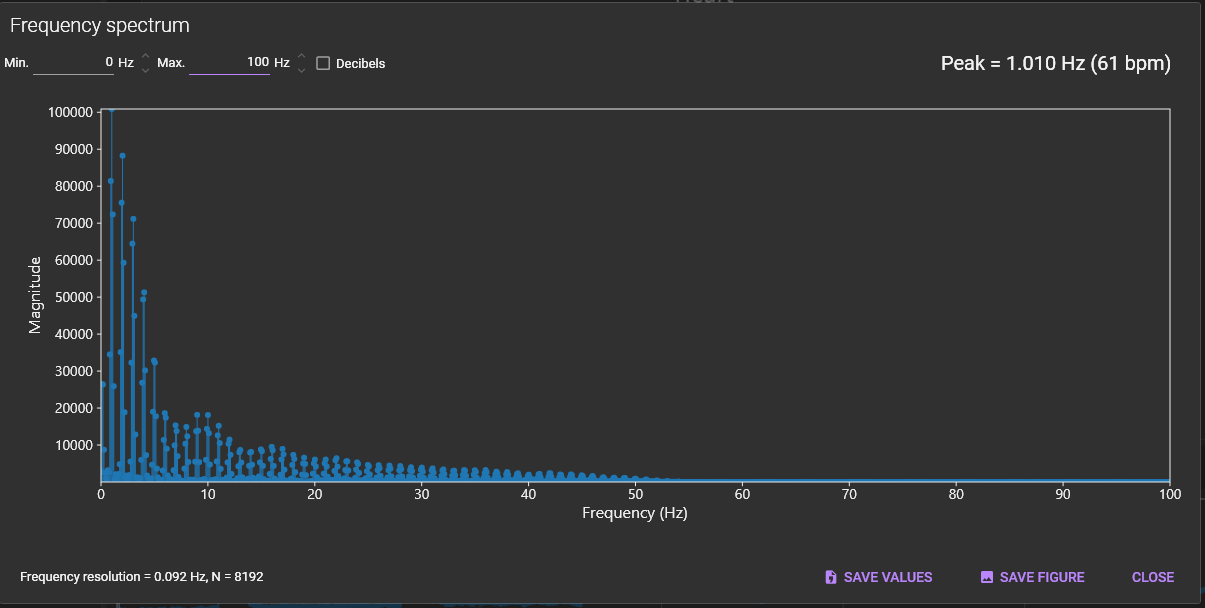
Displays frequency analysis results using FFT (X-axis: frequency (Hz), Y-axis: magnitude or decibels).
The following mouse operations are possible on the chart.
| Operation | Description |
|---|---|
| Scroll mouse wheel | Enlarge/reduce horizontal waveform size. |
| Right click | A popup menu is displayed. Specify display range of X-axis/Y-axis and set display/hide of grid lines. |

(1) Min
Set the minimum frequency to use for the X-axis.
(2) Max
Set the maximum frequency to use for the X-axis.
(3) Decibels
Change the Y-axis units to decibels.

(4) Peak
Display peak frequency.

(5) SAVE CSV
Click to save data in a csv file.
(6) SAVE FIGURE
Click to open “Figure editor”. See “Save image (figure editor)” for details.
(7) CLOSE
Close this dialog.