Phase plot (Hibert transform)
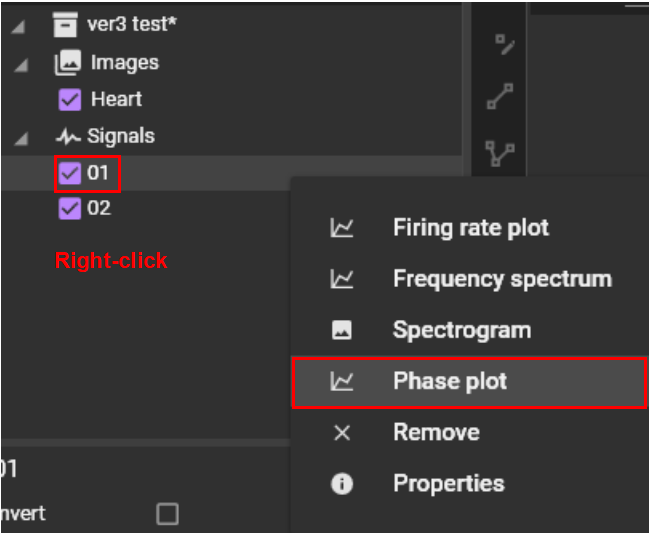
Right click on the signal name and select “Phase plot".
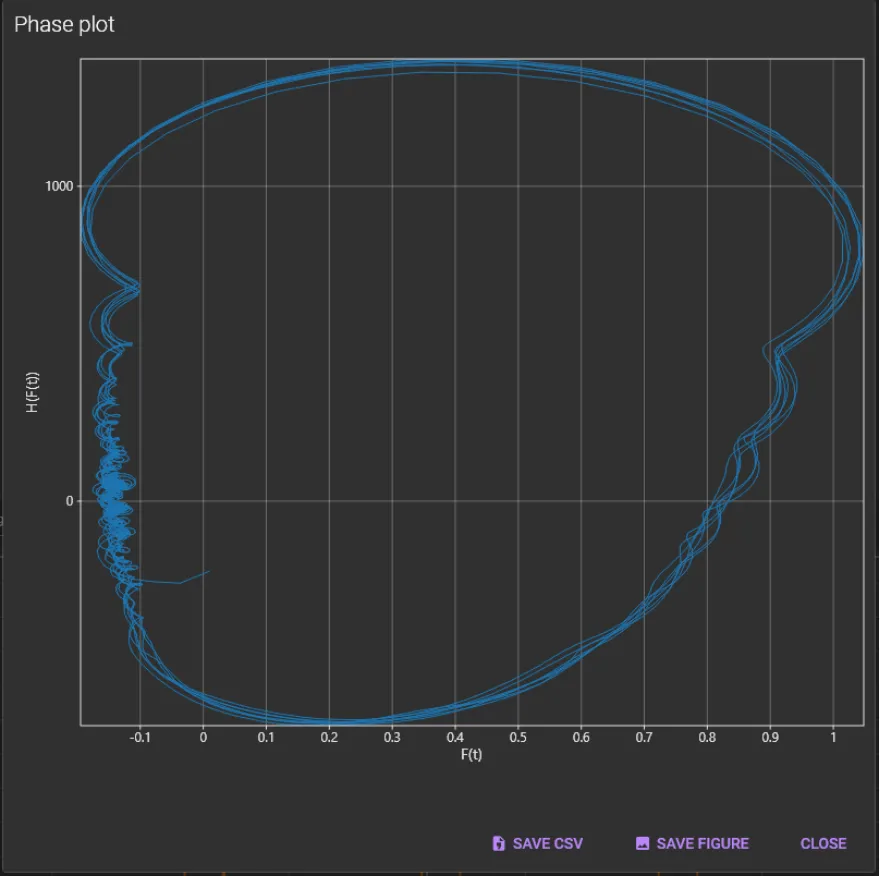
Displays the following phase plot.
The following mouse operation is possible on the chart.
| Operation | Description |
|---|---|
| Right click | A popup menu is displayed. Specify display range of X-axis/Y-axis and set display/hide of grid lines. |

(1) SAVE CSV
Click to save data in a csv file.
(2) SAVE FIGURE
Export phase plot as an image file. Click to open “Figure editor”. See “Save image (figure editor)” for details.
(3) CLOSE
Close this dialog.