Edit color map
Right-click on the image or color bar and click "Color map..." to display the following screen.
You can change the color map, color gradation, and colors used for pseudo-color of image display.
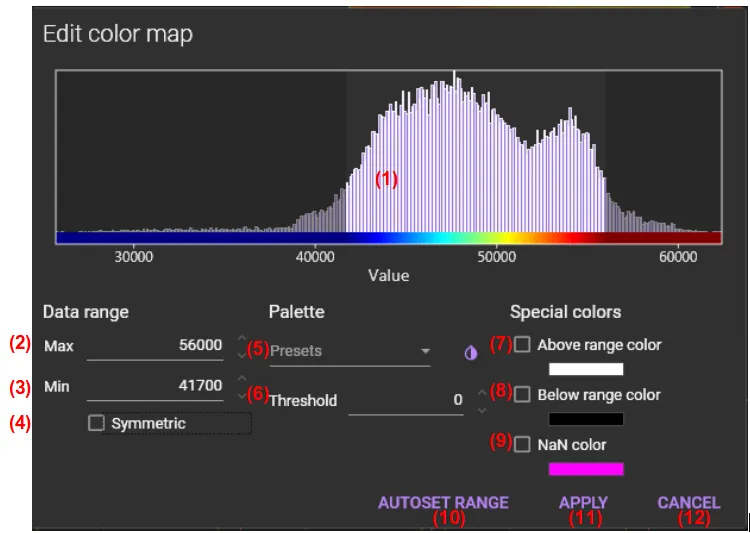
(1) Histogram
A histogram showing the correspondence between light intensity values (or difference value), colors and the number of pixels is displayed.

The following mouse operations are possible.
| Operation | Description |
|---|---|
| Move mouse left and right on the histogram | The range of light intensity values and the number of pixels are displayed in the upper left corner of the histogram. |
| Hold “Ctrl” key and drag mouse pointer to right | Select range of histogram. Color gradation is adjusted to fit the selected range. |
| Hold “Ctrl” key and click on the histogram | Deselect range of histogram and select all ranges. |
| Scroll mouse wheel | Zoom in / out histogram. |
(2) Max
Specifies the maximum light intensity value to draw with the color map.
(3) Min
Specifies the minimum light intensity value to draw with the color map.
(4) Symmetric
Set max and min so that the data range is symmetrical around 0.
(5) Presets
Select from preset color maps. When ![]() is clicked, color gradient can be inverted.
is clicked, color gradient can be inverted.
(6) Threshold
Specify the pixel threshold for pseudo-color display by light intensity value.
(7) Above range color / (8) Below range color
Specifies the color to draw pixels having light intensity values outside the specified range.
Click the area surrounded by the red frame to display the color palette.

(9) NaN color
Set the color to use for pixels with invalid values (NaN).
Click the area surrounded by the red frame to display the color palette.

(10) [AUTOSET RANGE]
Click to adjust to the best color gradation.
(11) [APPLY]
Reflects the setting value to the data on the main screen and closes this screen.
(12) [CANCEL]
Closes this screen without reflecting the setting values in the main screen data.