Basic operation
1. Open dataset
Select a directory containing dataset (acquired with BV Workbench Version 4 or later).
If you want to open data (file extension: "bvx" ) acquired by BV Workbench Version 2, please see "How to import data (*.bvx) acquired with Version 2".
If you want to open data (file extension: "tif" ) acquired by third-party camera systems, please see "How to import tiff files acquired by third-party camera systems".
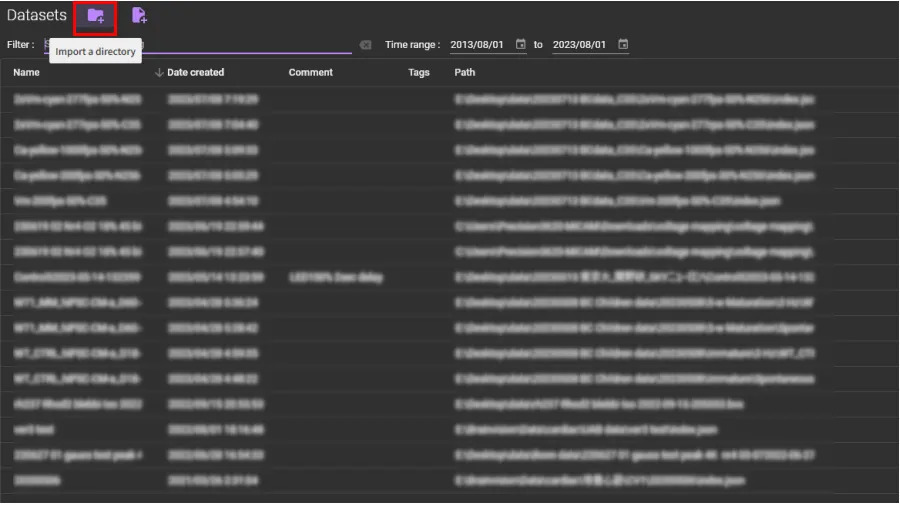
Click "Open dataset".

Click "Import a directory".
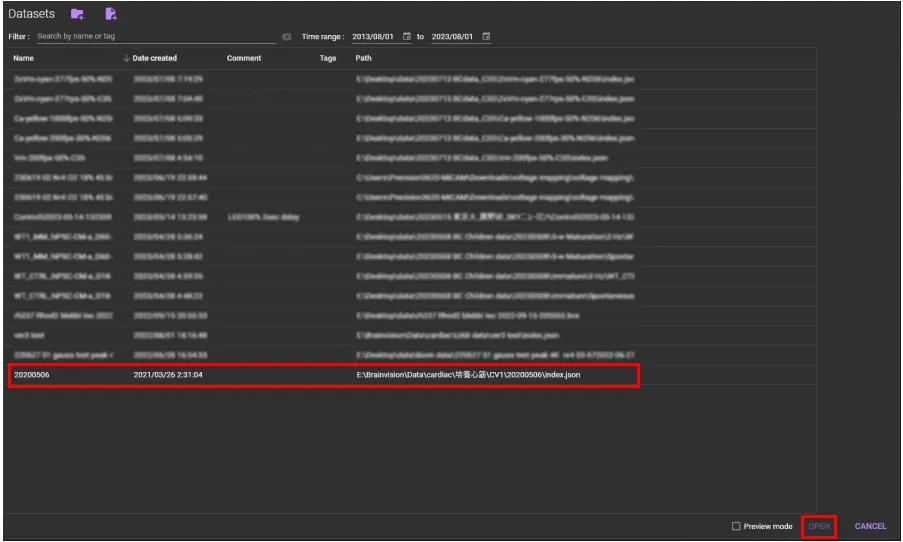
Data contained in the selected directory will be displayed on the list. After selecting the data name, click [OPEN] (or double-click the data name).
2. Image display
Auto set display range
Click "Auto set display range" to set the optimal display range (image gain and offset)

The display range (brightness range) can also be changed manually. Click data name on the tree on the left side of the screen, and change the "Max", "Min", etc. displayed below the tree.

Zoom in/out
You can zoom in/out image by scrolling the mouse wheel back and forth.
Left click to display waveforms
By left-clicking on the image, a waveform showing changes in fluorescence intensity at the clicked pixel is displayed.
Mouse drag point
Dragging the point with the mouse will change the waveform display accordingly.
Right click to display menu
Right-click on the image to display the menu.

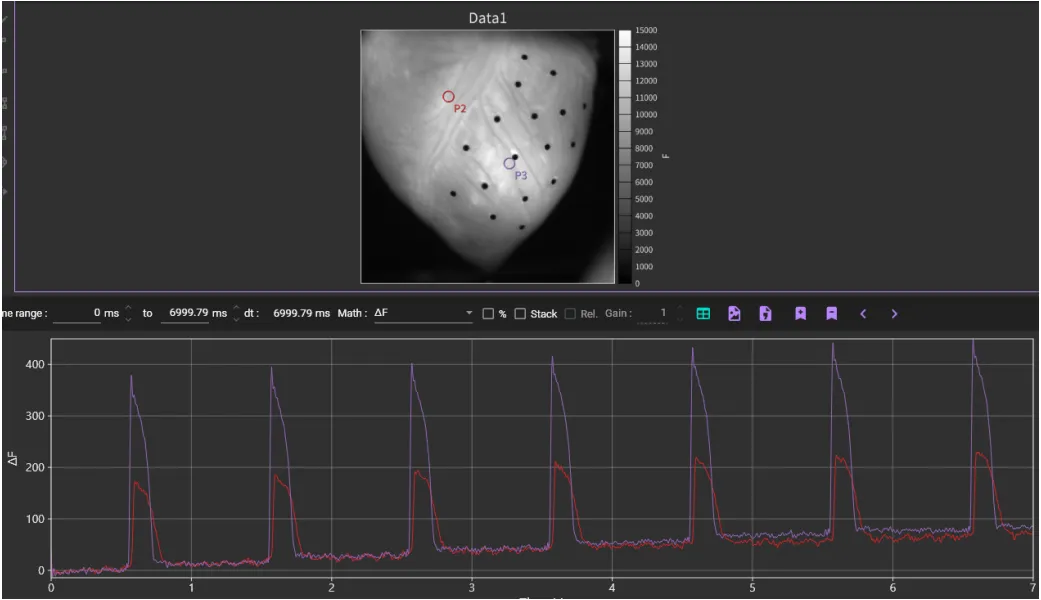
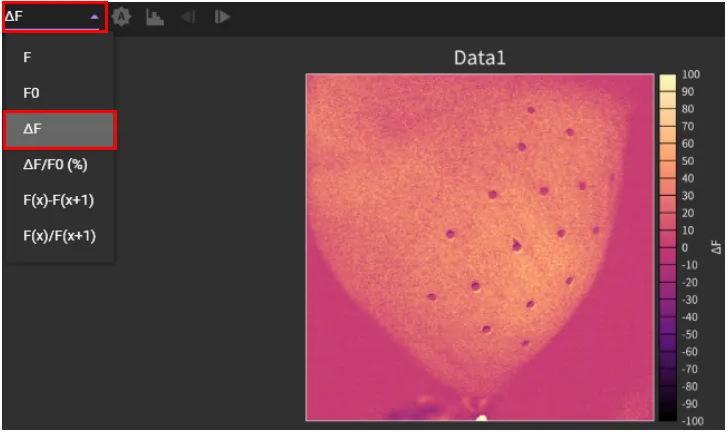
3. Show difference image
If you select "ΔF" from the list circled in red, the image will be displayed in differential values.
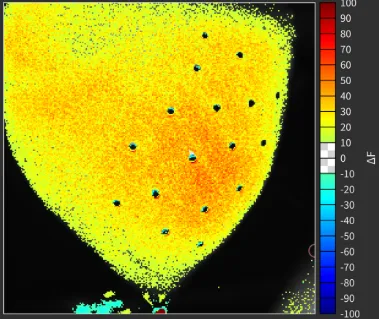
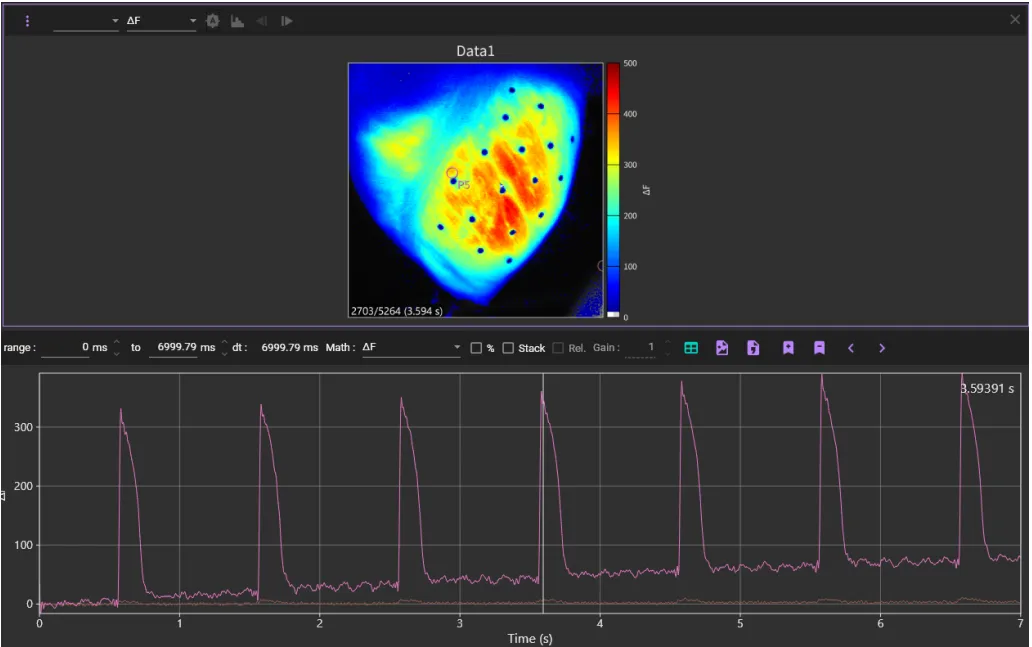
Change color pallete
You can change the color map for pseudo color from the palette list on the left side of the screen.

Change threshold
You can set the threshold for pseudo color display.

Save current setting as default
You can save the selected color palette as default by clicking the icon circled in red.

4. Waveform display
Left click to display waveforms
By left-clicking on the image, a waveform showing changes in fluorescence intensity at the clicked pixel is displayed.
Auto set display range
Click a waveform peak and then click ![]() icon.
icon.
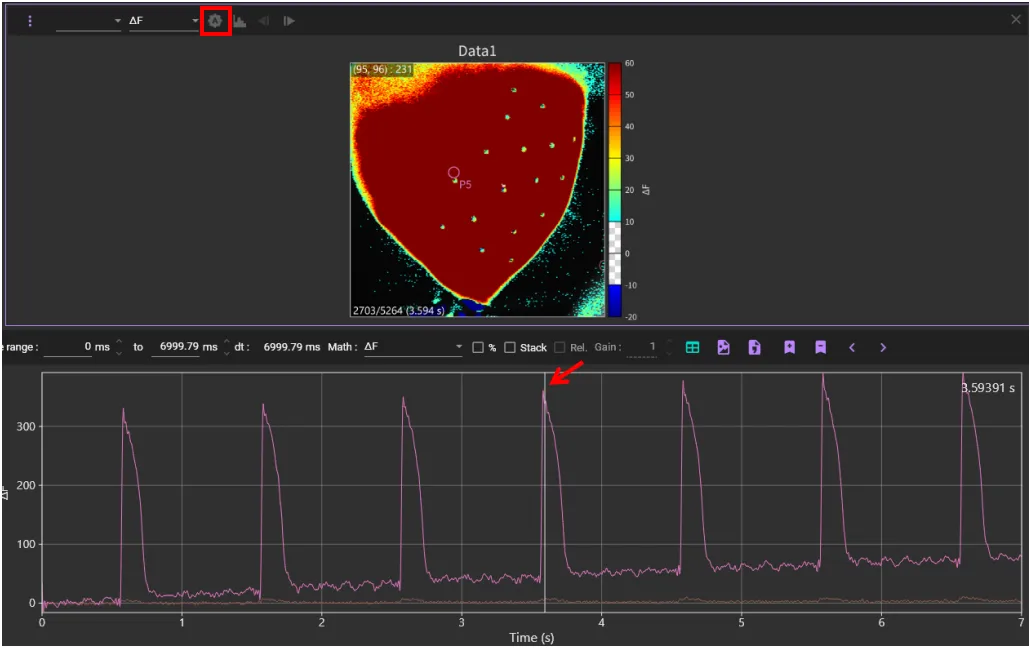
The pseudo color display range is set to the optimum value.
Drag mouse pointer on waveform
Drag mouse pointer left or right on waveform to move frame position.
Select a time range on waveform
Hold down the "Ctrl" key and drag the mouse pointer to right.
Zoom in/out
Scroll mouse wheel to zoom in/out waveform.
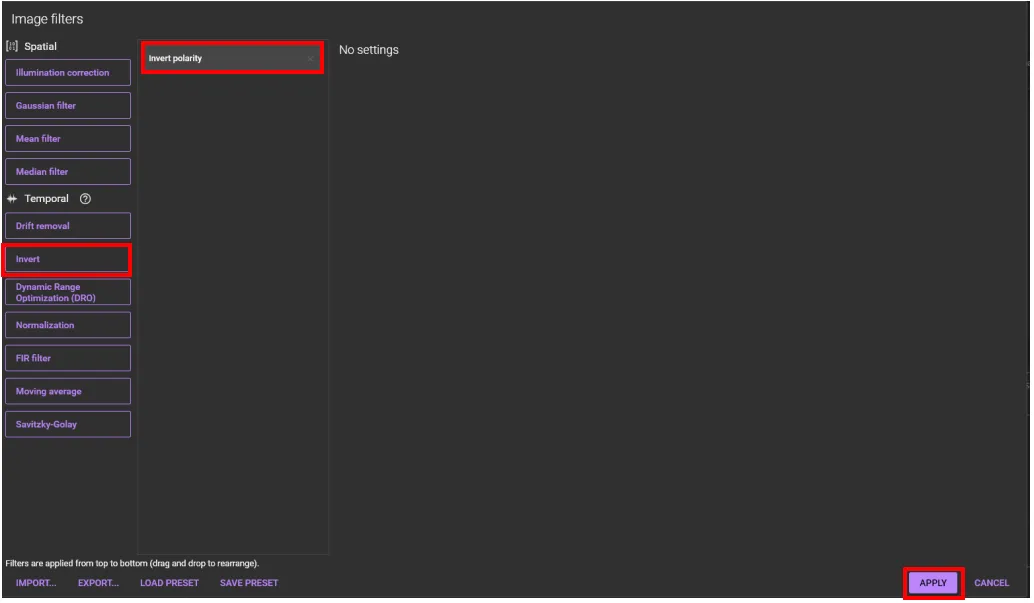
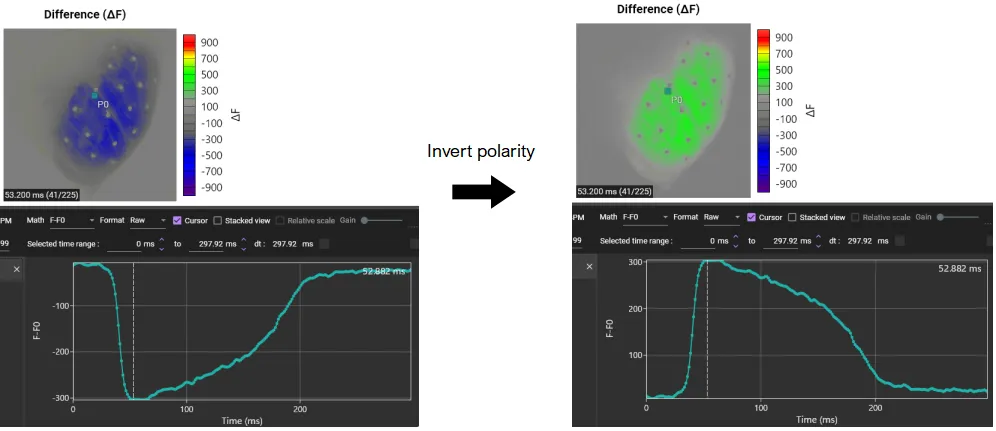
5. Invert polarity (for negative delta F signals)
Select "Apply filters..." from "Process" menu.

Select "Invert" from the list on the left. After confirming that "Invert" is displayed in the central list, click "Apply".
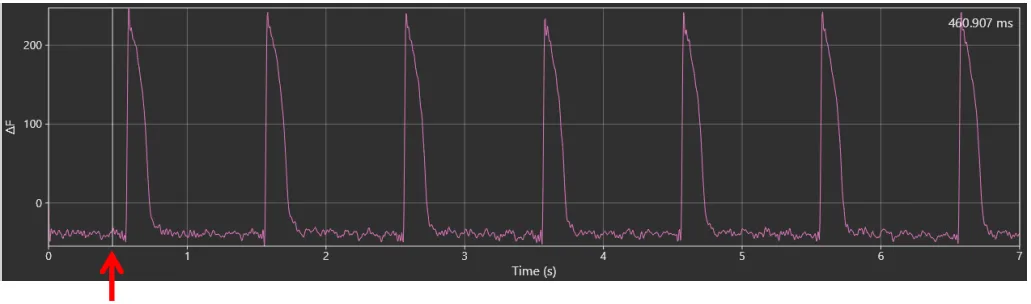
6. Change reference frame (F0)
By default, first frame (frame# 0) is reference frame (F0). However, there are cases where F0 does not become 0.
To change reference frame, click point (frame position) that shold be 0 on waveform.
Then, select "Set current frame as baseloine (F0)" from ![]() menu.
menu.
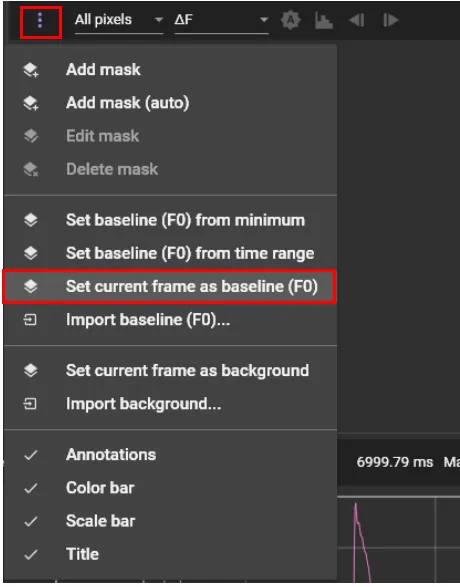
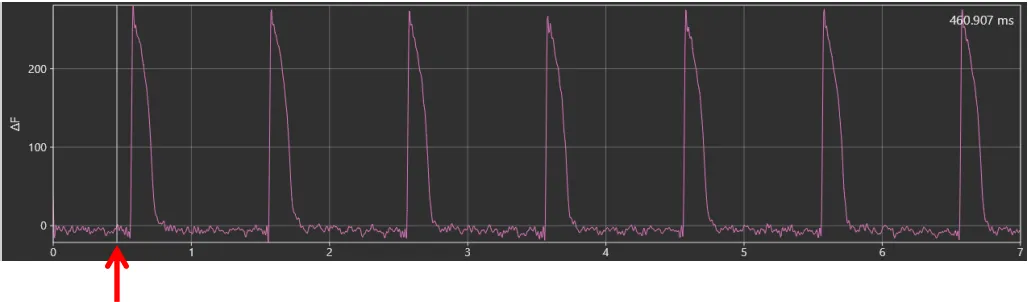
The value of the selected frame is set to 0.
For data where baseline is not clear, such as ventricular fibrillation data, "Set baseline (F0) from minimum" should be selected.
7. Forward and rewind one frame
The arrow pointing to the left rewinds one frame, and the arrow to the right forwards one frame.

8. Movie display
Select a time range on waveform by holding down the "Ctrl" key and drag the mouse pointer to right.
Click ![]() to start playing movie.
to start playing movie.
