Data acquisition page
0. Open acquisition window
There are the following two ways to open the acquisition window, (1) select [Acquisition] from [View] menu or (2) click [Record] on the main screen.
(1) Select [Acquisition] from [View] menu.

(2) Click [Record] on the main screen.
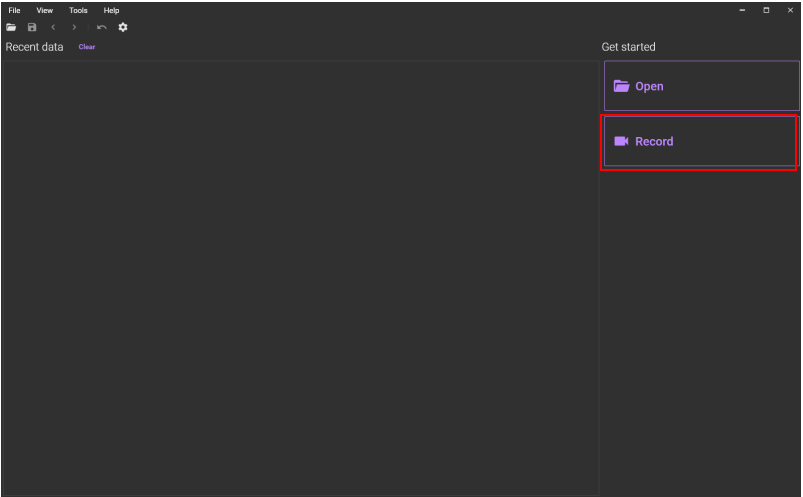
The following screen will appear. The screen for data acquisition and the screen for data analysis are displayed separately.
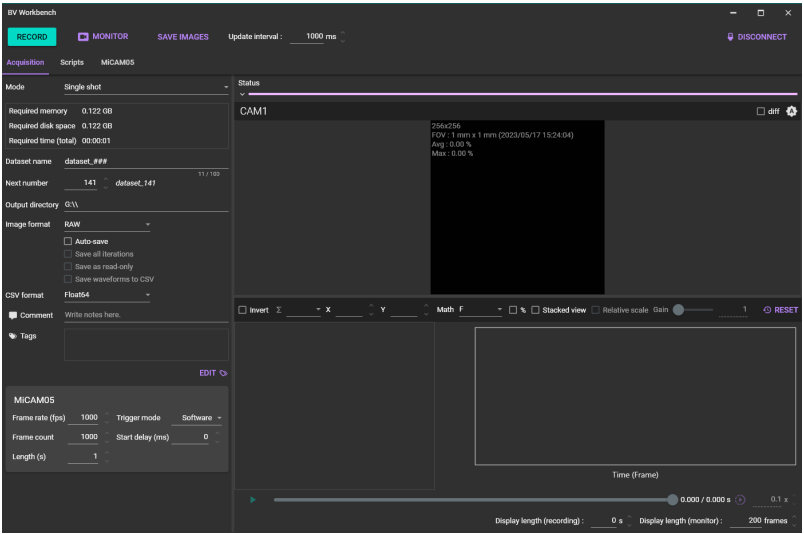
1. Acquisition window
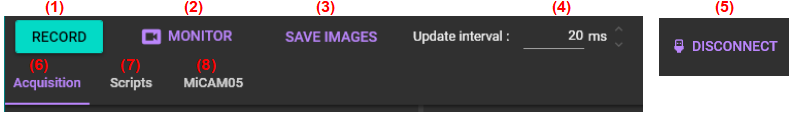
(1) RECORD
Click to start data acquisition using acquisition settings.
“Abort” is displayed during acquisition. You can abort acquisition by clicking “Abort”. Data acquired by time you click “Abort” is displayed on the software or saved to disk.
(2) MONITOR
Click to start sampling monitor. "Sampling monitor" is a mode that captures one frame with set exposure time at certain interval times. It is used for light intensity adjustment of light source, adjustment of optical system, focus adjustment and positioning of acquisition samples.
(3) SAVE IMAGES
Click to display a folder selection screen. If you select a folder on that screen, the currently displayed monitor image will be saved in the selected folder in png format.
(4) Update interval
Set interval of monitor image acquisition in ms.
(5) CONNECT / DISCONNECT
If you click [DISCONNECT], connection with camera will be canceled by this software. Use it when operation of camera is unstable.
Click [CONNECT] to resume connection with camera.
(6) [Acquisition] tab
Click to open [Acquisition] tab. Set data acquisition on that tab.
(7) [Scripts] tab
Click to open [Scripts] tab. Set “scripts” (code for automatic acquisition) on that tab.]
(8) [MiCAM05] tab
Click to open [MiCAM05] tab. Set acquisition settings for MiCAM05 on that tab.
2. Acquisition tab page
Click "Acqusition" tab to open the following [Acquisition] tab page. On this tab page, data is acquired using set acquisition conditions.
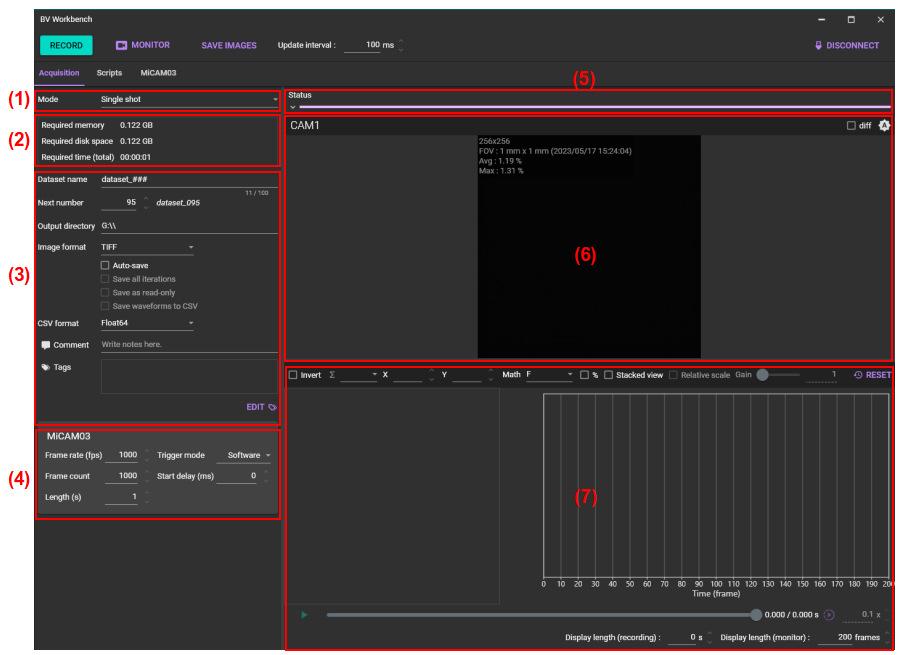
(1) Acquisition mode
The acquisition modes are as follow.
| (1-1) Single shot | Acquire once. Acquired data is temporarily stored in RAM of PC. It can be saved to PC from [Save] button. Since PC’s RAM is used as buffer memory for acquired data, number of recordable frames is smaller than [Single shot to disk]. |
|---|---|
| (1-2) Single shot (direct to disk) | Acquire once. Acquired data is automatically saved to drive of PC concurrently with data acquisition. Since acquired data is written directly to SSD (Solid State Disk) or HDD, it is possible to record for a longer time than [Single shot] mode (under conditions with a large amount of data per unit time, such as higher resolutions, faster frame rate, multi camera, the buffer memory inside the MiCAM05/MiCAM03 becomes fill easily and there is an upper limit on the number of recordable frames). |
| (1-3) Averaging | Averaging trials. Acquired data is temporarily stored in RAM of PC. It can be saved to PC from [Save] button. |
| (1-4) Stim->NoStim | 1 trial consists of two data acquisitions. (acquisition with pulse output)-(acquisition without pulse output) To remove noise due to periodic fluctuation derived from heartbeat etc. when using In Vivo sample, "Stim-NoStim" mode or "NoStim-Stim" mode is useful. |
| (1-5) Multi-pattern | Acquires multiple image data. Acquired data is temporarily stored in RAM of PC. You can save data to your PC with [Save] button. |
| (1-6) Time-lapse | This mode is for acquiring one frame intermittently at certain time intervals. Acquired data is temporarily stored in RAM of PC. It can be saved to PC from [Save] button. |
(1-1) Single shot
![]()
If “Auto-save” is OFF, you can save data to your PC with [Save] button.
![]()
If “Auto-save” is ON, acquired data is automatically saved in drive of PC after acquisition.
![]()
(1-2) Single shot (direct to disk)
![]()
(1-3) Averaging

| Iteration count | Number of averaging |
|---|---|
| Iteration interval (ms) | Interval between each trial |
If “Auto-save” is OFF, you can save data to your PC with [Save] button.
![]()
If “Auto-save” is ON, acquired data is automatically saved in drive of PC after acquisition. In addition, if “Save all iterations” is ON, each trial data is also saved to disk.
![]()
(1-4) Stim->NoStim
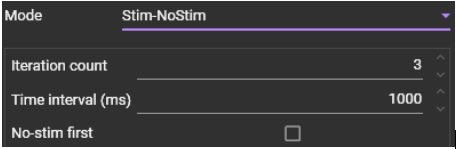
| Iteration count | Number of averaging |
|---|---|
| Time interval (ms) | Interval between each trial |
| No-stim first | 1 trial consists of two data acquisitions by the following order. (acquisition without pulse output)-(acquisition with pulse output) |
(1-5) Multi-pattern
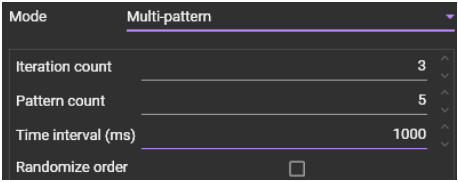
| Iteration count | Number of averaging |
|---|---|
| Pattern count | Number of pattern |
| Iteration interval (ms) | Interval between each trial |
| Randomize order | Acquire data in random order |
(1-6) Time-lapse

| Frame count | Number of acquired frames |
|---|---|
| Time interval (ms) | Interval between each frame |
(2) Required memory / Required disk space / Required time

| Required memory | Amount of required memory |
|---|---|
| Required disk space | Required disk space |
| Required time (total) | Total number of recording time |
(3) Settings for data format, dataset name, comment and tags
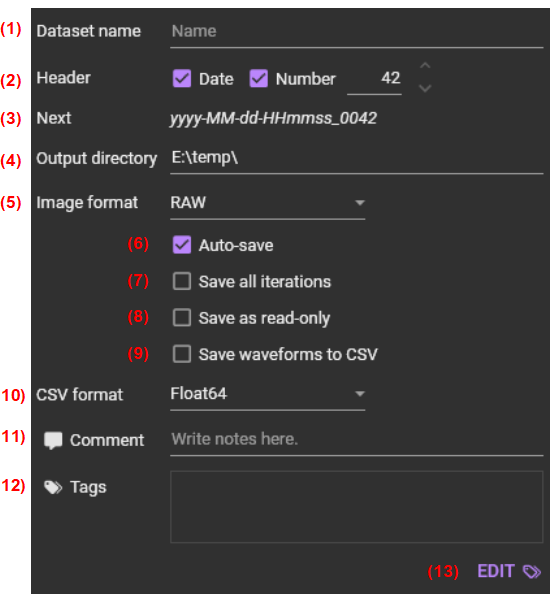
(1) Dataset name
Enter characters to be added at the end of dataset name. Up to 60 characters.
(2) Header
Specify header of dataset name.
If “Date” is ON, “yyyy-MM-dd-HHmmss_” is added at the first of dataset name.
If ”Number” is ON, number (4 digits) next to "Number" is added to the right of date (if “Date” is ON) or the first of dataset name (if “Date” is OFF).
(3) Next
Show dataset name used for next acquired data.
e.g. “yyyy-MM-dd-HHmmss_” (date) + “NNNN” (number) + (dataset name)
(4) Output directory
Display directory where data is saved. Click this area to display the folder selection screen, and you can change to any directory.
(5) Image format
Select format of image data from “RAW”, “TIFF”. You can change image format later by using the optional software (“BV Image Converter”).
| RAW | New format designed for image with multiple regions and extensible metadata. Uses less disk space than other formats when regions of interest are small. If acquisition mode is [Single shot to disk], RAW is automatically selected as an image format. We recommend that you use this format unless otherwise specified. |
|---|---|
| TIFF | Standard file format. BV Workbench will switch to BigTIFF automatically when the file is larger than 4 GB. If you save image data in TIFF format, you can load it into other data analysis software. |
(6) Auto save
| ON | Acquired data is automatically saved in directory specified in (4) output directory. No data is displayed on the software after acquisition. |
|---|---|
| TIFF | Standard file format. BV Workbench will switch to BigTIFF automatically when the file is larger than 4 GB. If you save image data in TIFF format, you can load it into other data analysis software. |
(7) Save all iterations
This can be specified when the “(6) Auto save” check box is ON.
| ON | If (1) Acquisition mode is “Averaging” or “Stim->NoStim” or “Multi-Pattern”, not only averaged data, but also each trial data is saved. |
|---|---|
| OFF | If (1) Acquisition mode is “Averaging” or “Stim->NoStim” or “Multi-Pattern”, only averaged data is saved. If (1) Acquisition mode is “Single shot” or “Single shot to disk” or “Time-lapse”, only single shot data is saved. |
(8) Save as read-only
This can be specified when the “ (6) Auto save” check box is ON.
| ON | Data is saved with read-only mode ON. |
|---|---|
| OFF | Data is saved with read-only mode OFF. |
(9) Save waveforms to CSV
This can be specified when the “ (6) Auto save” check box is ON.
| ON | Analog signals input to analog input1 / analog input2 / analog input3 / analog input4 of the MiCAM05 processor is automatically saved as a CSV file in the format specified in “ (10) CSV format”, in addition to binary format files. |
|---|---|
| OFF | Analog signals input to analog input port(s) of the MICAM05/MiCAM03 processor is not saved in a CSV file (those are saved in binary format files). |
(10) CSV format
Specify data format of a CSV file saved when “ (9) Save waveformts to CSV” is ON.
(11) Comment
You can enter a comment. Comments are saved with data and can be referenced when opening data.
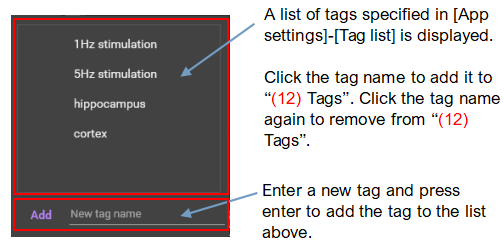
(12) Tags
A list of tags specified in “ (13) Edit” is displayed.
(13) EDIT
A screen where you can specify tags is displayed.
(4) MiCAM05/MiCAM03 acquisition settings
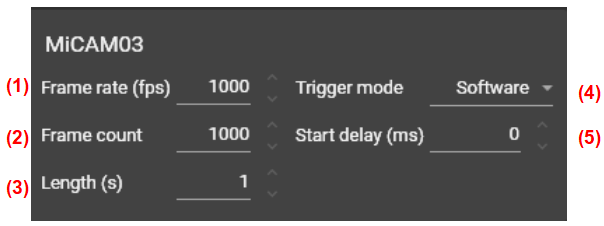
(1) Frame rate (fps)
Frame rate specified on the MiCAM05 setting screen is displayed. You can change it manually or by clicking the arrow buttons. Exposure time (msec) is 1000 / frame rate (fps).
(2) Frame count
Number of frames to be acquired is displayed. You can change it manually or by clicking the arrow buttons.If you change this value, “ (3) Length (s)” will also change automatically.
Frame count = Frame rate (fps) x Length (s)
(3) Length (s)
Acquisition time is displayed in seconds. ou can change it manually or by clicking the arrow buttons. If you change this value, “ (2) Frame count” will also change automatically.
Length (s) = Frame count / Frame rate (fps)
(4) Trigger mode
Trigger mode specified on the MiCAM05/MiCAM03 setting screen. You can change it by selecting either one from “Software”, “External”, “Ain1 /w CMP”, “Optional”.
(5) Status

(1) Status
Status related to data acquisition by MiCAM05/MiCAM03 is displayed.
(2) Detailed status and status history display
Click during data acquisition or after data acquisition to display detailed status and status history.
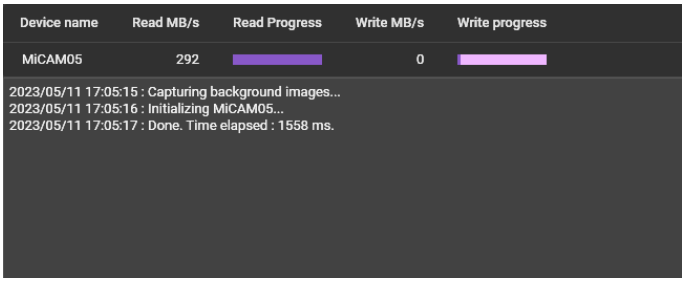
(3) Bar showing progress of data acquisition
Displays progress of data acquisition.
(6) Monitor area
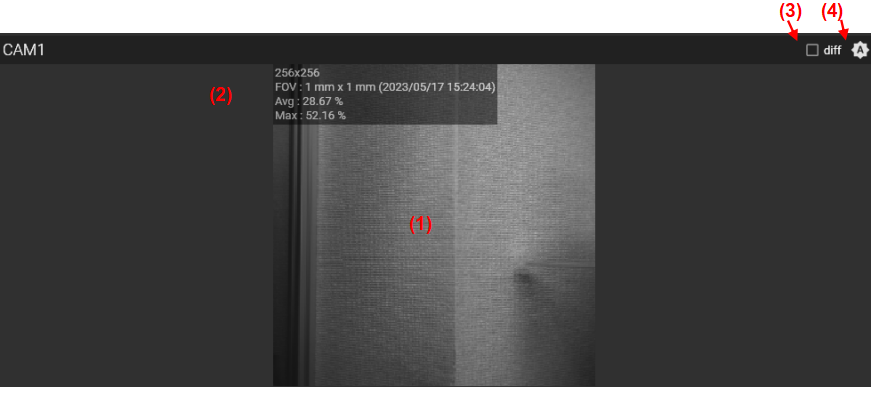
(1) Monitor screen
Click the [MONITOR] button to display monitored image in this screen.
In addition, acquisition data is previewed immediately after acquisition.
(2) Monitor information display
Display information during monitoring.
| Number of pixels | Show number of pixels |
|---|---|
| FOV | Field of view size |
| Avg | Display average intensity of pixels in a specified ROI in %. 100% indicates pixel saturation level. |
| Max | Display maximum intensity of pixels in a specified ROI in %. 100% indicates pixel saturation level. |
(3) Show differential image
Monitor image is usually displayed using absolute values of light intensities. When this check box is selected, monitor image is displayed as an image using difference values of light intensities based on image at start of monitor.
You can change pseudo color by right-clicking an (1) monitor screen and clicking "Edit color map..." displayed.
(4) Auto adjustment
Click to automatically set the gain of the image to the optimum value.
(7) Waveform display
Change in light intensity at specified point during monitoring is displayed as a waveform.
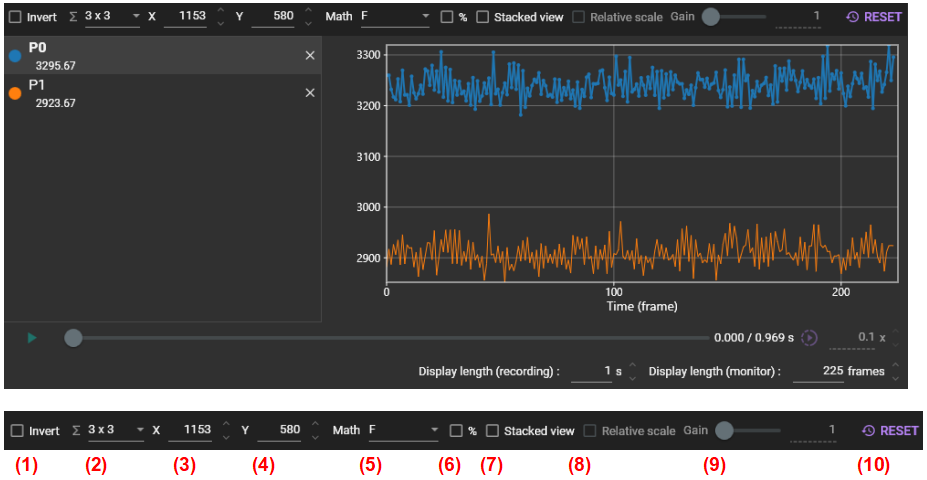
(1) Invert
Flip the waveform upside down while monitoring. Click on waveform name to select it before selecting this check box.
(2) ROI size
Specify size of point (ROI) for waveform display. When 3x3 is selected, average value of 9 pixels is displayed as a waveform. Click on waveform name to select it before specifying ROI size.
(3) X coordinate
Specify X coordinate of point for waveform display. Enter it manually or click arrow buttons to specify a number. Click on waveform name to select it before specifying this.
(4) Y coordinate
Specify Y coordinate of point for waveform display. Enter it manually or click arrow buttons to specify a number. Click on waveform name to select it before specifying this.
(5) Math
Specify unit of waveform display.
| F | Absolute light intensity value. |
|---|---|
| F-F0 | Differential light intensity value between each frame and first frame. |
| dF/dt | First derivative value of absolute light intensity value. |
| d((F-F0)/F0)/dt | First derivative value of rate of change in light intensity. |
(6) %
When selected, waveform is displayed at the rate of change.
(7) Stacked view
Arrange all displayed waveforms so that they are evenly spaced.
(8) Relative scale
It can be checked when waveform is in “ (7) Stacked view” mode. If checked, the largest waveform will be vertically scaled to fit height of chart, while other waveforms will maintain their relative amplitudes. If amplitude difference is irregular, remove the check.
(9) Gain
Available when waveform is in “ (7) Stacked view mode” and “ (8) Relative scale” is selected. Adjusts gain in height direction of waveform.
(10) RESET
Clear waveform display.
(11) Waveform list
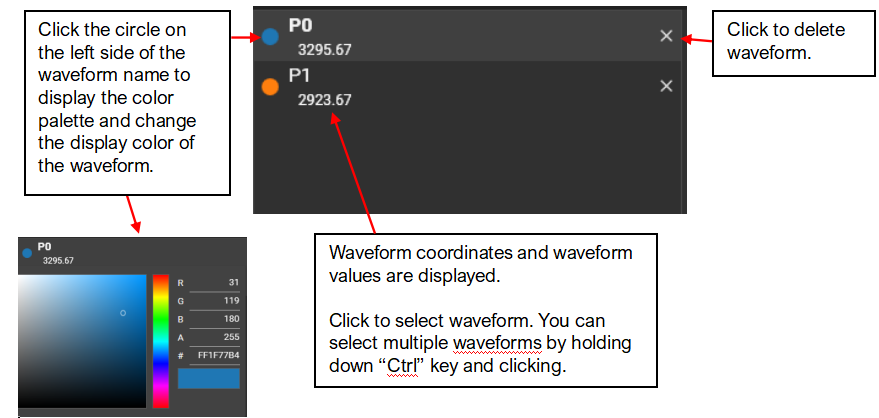
(12) Waveform screen
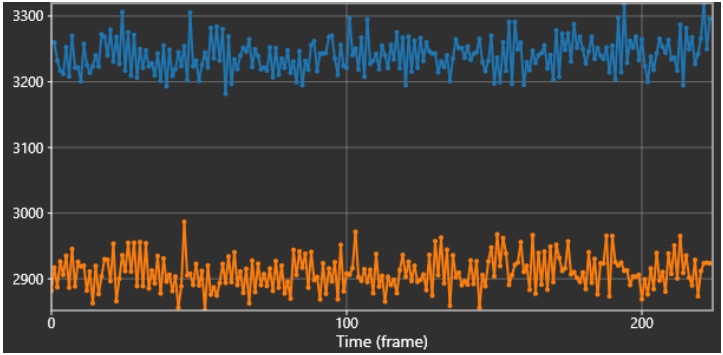
Horizontal axis shows time (frame) and vertical axis shows light intensity. Waveforms are also automatically drawn according to changes in light intensity during monitoring. The following mouse operations are possible on the waveform.
| Operation | Description |
|---|---|
| Scroll mouse wheel | Enlarges or reduces waveform scale. |
| Right click | A screen for setting range of waveform X-axis and Y-axis is displayed.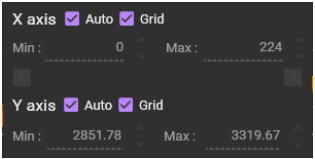 |
(13) Preview during acquisition
![]()
Enabled only during acquisition. By clicking the ![]() button or moving the horizontal slide bar, data that has already been acquired can be displayed as a movie.
button or moving the horizontal slide bar, data that has already been acquired can be displayed as a movie.
(14) Display length
![]()
Sets length of the X-axis of the waveform displayed during acquisition or monitoring.