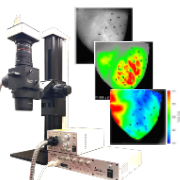
Voltage Sensitive Dye Imaging of Membrane Potential
For More Detailed Analysis of Neuronal/Cardiac Activity
-
Brain Slice (Hippocampus)
-
Isolated Heart
-
Cultured Cardiomyocytes
-
Isolated Heart (Ventricular Fibrillation)
Higher throughput in comparison to electrophysiological methods
Electrodes are generally used to record electrical activity of biological samples. However, methods using electrodes have the following disadvantages.
- Activity can only be recorded near or around an electrode insertion site
- Physical damage to sample can be caused by electrodes
- Specialized skills and Experience are required for electrode insertion
- Only electrical activity can be recorded
Voltage sensitive dye imaging can solve these problems.
Voltage sensitive dye changes its absorbance and fluorescence intensity when membrane potential changes in a stained brain or heart tissue.
By using voltage sensitive dyes as chemical probes and capturing changes in light intensity with the use of a high-speed imaging device, it is possible to image in real time the activity of where, when, and how much excitation or inhibition occurred, in the brain and heart.
The main advantage of optical mapping with voltage sensitive dye is that spatial information can be obtained without reducing the number of recording points, simply by changing the magnification of the optics.
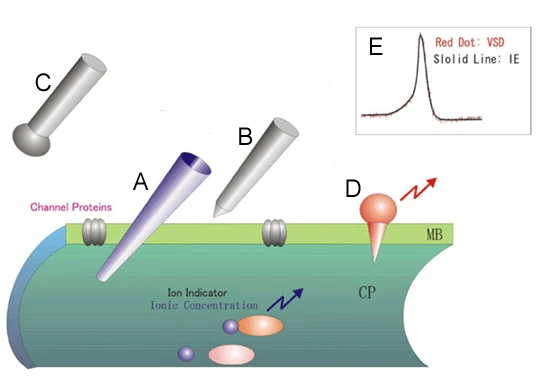
(A) Glass electrode penetrating the neuronal membrane.
(B and C) Metal electrodes for recording
extracellular activity
(D) Voltage sensitive dyes are molecular probes that enter the neuronal
membrane and convert membrane potential into fluorescence intensity. The figure shown in E is the
action potential of a giant squid nerve axon; the solid black line is the intracellualr recording
and the red dots show the voltage sensitive dye recording.
3 Advantages of Voltage Sensitive Dye Imaging
1. Non-invasive recording of active in entire tissue or sample
- No physical damage due to the use of light to capture changes in action potentials of brain/heart tissue.
-
Activity and signal propagation can be visualized simultaneously in a wide field of view
2. Easy recording without electrophysiological skills
- Experience of electrophysiological techniques such as patch-clamp and
intracellular recording is not required.
In addition, more data can be acquired, compared to conventional techniques using electrodes. -
Signals can be recorded at 10,000-65,536 points.
3. Multi-parametric recording of Vm, Ca2+, metabolism...etc is possible.
- It is possible to simultaneously record changes in calcium concentration and/or metabolism-related indicators, as well as membrane potential, when suitable fluorescence dyes/filters are chosen.
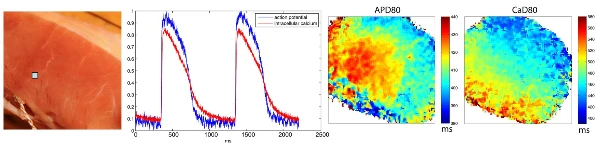 Simultaneous imaging of membrane potential and calcium transient activity in isolated human heart
Sample data
Examples of animals, samples, and probes/methods used for optical mapping
| Animal | Sample | Probe/Method | |
|---|---|---|---|
| Pig Rat Mouse Zebrafish |
Isolated heart | - Langendorff perfused heart - In Vivo heart |
- Simultaneous dual wavelength imaging of membrane potntial and ca2+ transient - Panoramic imaging of heart by using multiple cameras |
| - | Cultured cardiomyocyte sheet | - iPSC-derived cardiomyocytes (iPSC-CMs) | - Voltage sensitive dye imaging - Calcium imaging |
| Monkey Rat Mouse |
In Vivo brain | - Somatosensory cortex - Visual cortex - Auditory cortex |
- Voltage sensitive dye imaging - Imaging with FRET, GCaMP, GEVI - Intrinsic optical signal imaging based on hemoglobin and flavoprotein autofluorescence |
| Rat Mouse |
Brain slice | - Hippocampus - Somatosensory cortex - Visual cortex - Auditory cortex |
- Voltage sensitive dye imaging - Intrinsic optical signal imaging |
High speed voltage sensitive dye imaging of spontaneous activities in cultured neuronal network
Monolayer of neonatal mouse ventricular myocyte stained with voltage sensitive dye
Voltage sensitive dye imaging of isolated langendorff pig heart at 1,818fps
Voltage sensitive dye imaging of brain slice using MiCAM05-N256
About Us
SciMedia specializes in complete turn-key, high speed optical mapping systems for neuroscience and
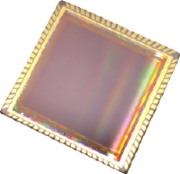
cardiac research. Our cameras utilize unique CMOS sensors, which are designed to detect voltage,
calcium, and intrinsic signals, while providing an optimal combination of high speed, high resolution,
and high signal to noise ratios.
Since 1998, SciMedia has been supporting customers and collaborating with
labs internationally. Based on ideas and requests from researchers, we strive to offer the highest
quality optical mapping systems including both hardware devices and software..
Our Advantages

High-Speed Imaging Systems developed for Voltage Sensitive Dye Imaging
-
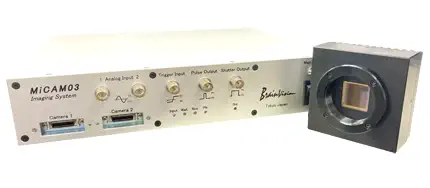
High Speed Imaging SystemMiCAM03-N256
Standard model for high speed imaging with
excellent balance of high speed and high S/N ratios- Resolution: 256x256 - 32x32 pixels
- Maximum frame rate: 1,923fps (at 256x256 pixels)
- Camera port: 2 -
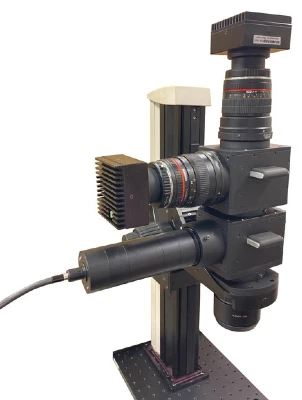
Fluorescence MesoscopeTHT Mesoscope
Optical system for detecting low light fluorescence
in a wide field of view- Low magnifications with high N.A values : suitable for mesoscopic fluorescence optical mapping
- Multifunctional: also can be used as a fluorescence beam splitter
Download - Brochure
-
High Speed Imaging System MiCAM Series (2019)
-
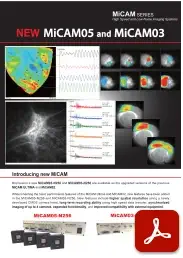
MiCAM05-N256 and MiCAM03-N256
FAQ
Free Download - Data Analysis Software
Perform data analysis with actual voltage sensitive dye data. Data analysis software, BV_Ana, and isolated heart/brain slice data can be downloaded.
(Note: Sales and support for BV_Ana have ended. The latest version of data analysis software is BV Workbench.)
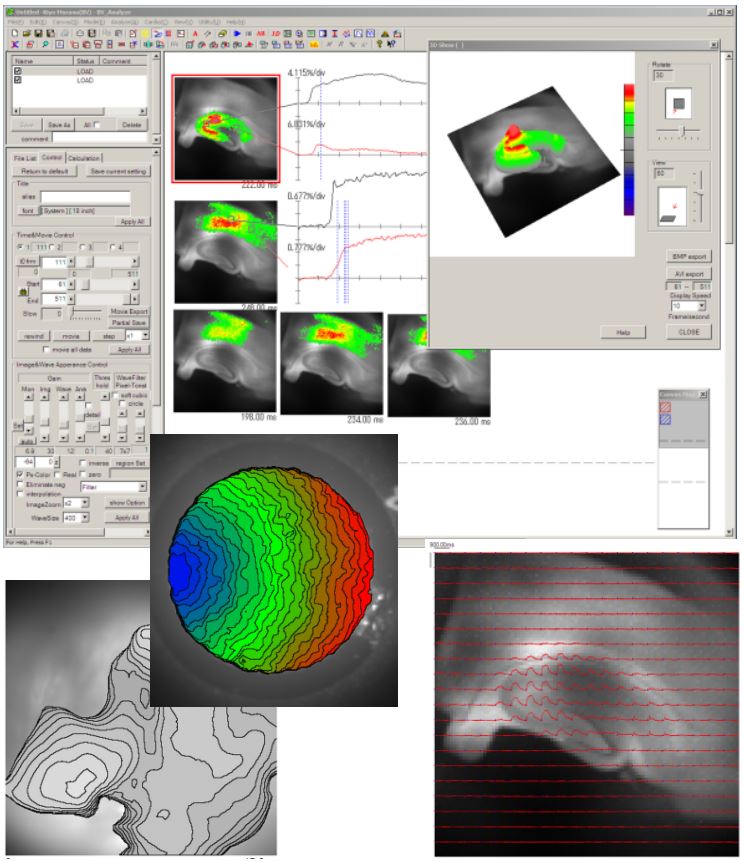
BV_Ana
BV_Ana is the data analysis software for MiCAM series imaging systems. It has an intuitive user interface and is designed for users to quickly analyze data after image acquisition. In addition to quick image and movie display with user selected wave display, various types of filters are available, as well as data export functions for multiple data formats including avi, jpeg, csv, simple binary/ascii, multi-tiff, etc…Creation of data files for presentations is very simple and straightforward.
Key Functions
| Image display | dF display, real image display, image gain setting, threshold level setting, color bar display, color reversal, tile image display, etc. |
|---|---|
| Time control | Video playback, video speed control, frame by frame playback, adjustment of playback speed, Frame number/time display, etc. |
| Waveform display | Waveform display by double-clicking on image, expanding/reducing the displayed time range, spatial filters, temporal filters, etc. |
| Supported data format | - Data acquired from MiCAM ULTIMA, MiCMA02, MiCAM01 - 16bit gray-scale multi-tiff |
| Output files | AVI/BMP/TIFF/JPEG/CSV/ASCII/Binary |
Recommended Specifications
| OS | Windows 7 32bit/64bit Windows 10 64bit |
|---|---|
| RAM | 256MB or more |
| Display resolution | 1,920x1,200 pixels recommended |
How to install/use BV_Ana
1. After registering your email address, click the link in the email that will automatically be sent to
you, then download the zip file.
(See the bottom of this page for email registration
instructions.)
Zip file including the installer of BV_Ana and sample data
2. Unzip the downloaded zip file.
3. Double-click the BV_Ana installer in the folder to start installing BV_Ana.

Installer of BV_Ana
4. After installation, click the icon of BV_Ana in the Start menu to start BV_Ana.
Icon of BV_Ana
5. BV_Ana is opened.
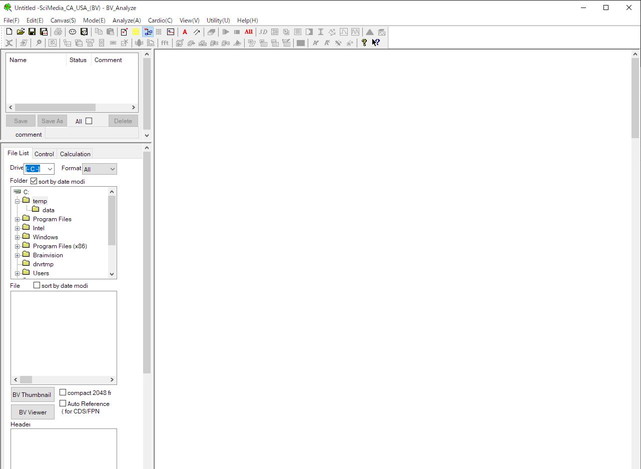
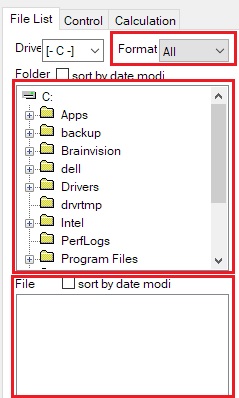
6. Select “Format=All”.
Expand the "Folder" tree to display the "data" folder, which is included in the downloaded folder.
Double-click the data name displayed in the “File List” to open the data on the canvas.
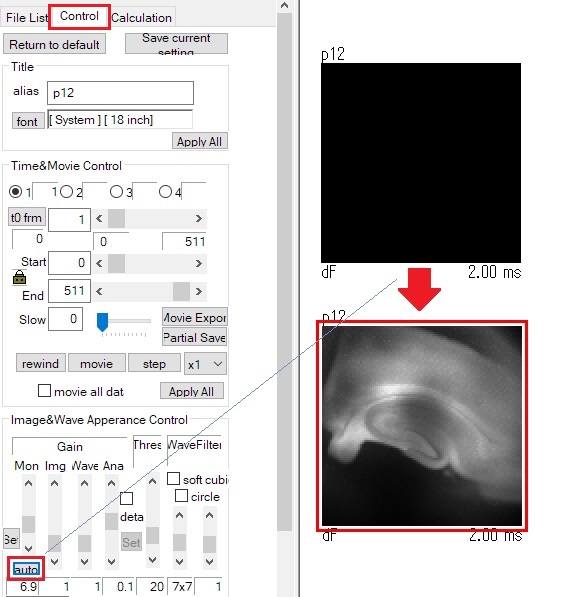
7. Click the Control tab. Click the [auto] button below the [Mon] slide bar to automatically adjust the
gain of the background image.
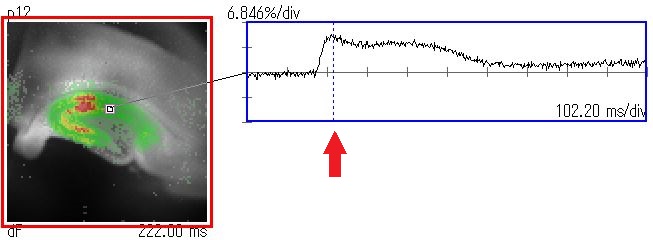
8. Double-click on the image to display a waveform.
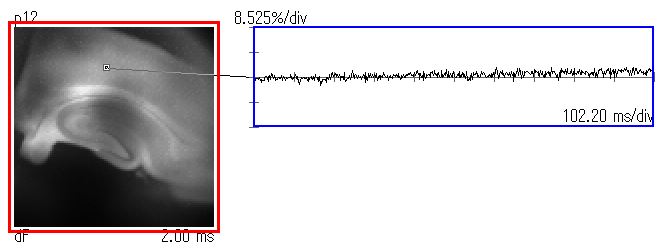
9. Click and drag the point on the image, and the waveform display will change accordingly.
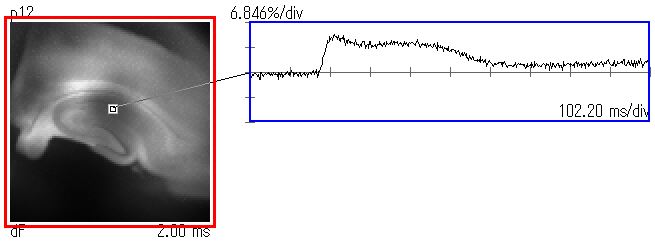
10. Click on the waveform display. Membrane potential (fluorescence) change at the selected point will
be displayed in pseudo-color.
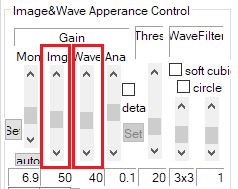
11. Click "Img" arrows or drag scroll bar to adjust displayed gain of pseudo color. Click "Wave" arrows
or drag scroll bar to adjust gain of waveforms.
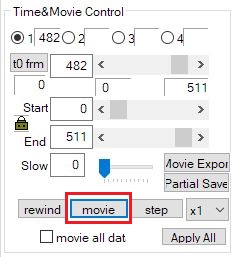
12. Click the "movie" button to play the video.
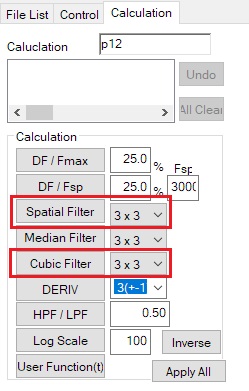
13. To smooth the image data and wave/s displayed, "Spatial filter" and/or "Cubic filter" on the
"Calculation" are helpful.
14. By double-clicking on the image, multiple waveforms can be displayed.
15. By clicking and dragging a pointer, the waveform (light intensity change) at different locations can
be displayed.