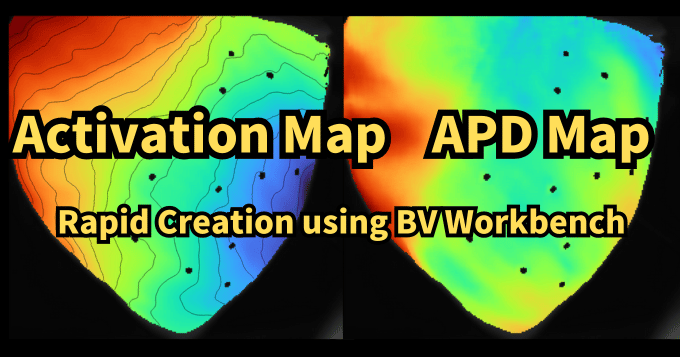
Optical Mapping Heart Activity:
A Case Study on Rapid Creation of
Activation Maps and APD Maps Using BV Workbench
Introduction: The Importance of High-Resolution Mapping Analysis
In the field of cardiac electrophysiology, optical mapping has become a fundamental tool for simultaneously recording myocardial optical action potentials (OAPs) with high spatiotemporal resolution.
In particular, a detailed understanding of the characteristics of cardiac excitation propagation (Activation) and repolarization is indispensable for elucidating the mechanisms of arrhythmia.
However, the appropriate selection of data processing and analysis methods is critically important, as it can influence the interpretation of optical signals and the conclusions of research findings.
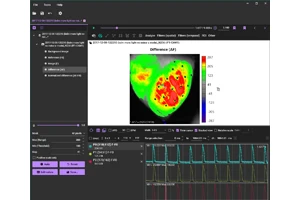
This article introduces BV Workbench Ver. 4 , an optical mapping and calcium imaging analysis software developed by Brainvision Inc., and showcases its features and a case study on how researchers can quickly and with high precision create and analyze Activation Maps and APD (Action Potential Duration) Maps.
Features and Research Applications of BV Workbench

BV Workbench Ver. 4
is the latest version developed for the analysis of optical mapping and
calcium imaging data from the brain and heart.
Notably, its
cardiac analysis capabilities have been significantly enhanced compared to
previous versions, with improvements to various map display functions and
image export features.
The software is compatible with:
-
Cardiac Samples:
Langendorff-perfused isolated hearts, cardiac slices, and cultured cardiomyocytes (e.g., hiPSC-CMs). -
Fluorescent Dyes:
Voltage-sensitive dyes (e.g., Di-4-ANEPPS, FluoVolt) and calcium-sensitive dyes (e.g., Fluo-4, Cal520). -
Data Formats:
It offers high compatibility, capable of loading not only RAW data files acquired with Brainvision's MiCAM imaging systems but also common 16-bit grayscale TIFF files from third-party cameras and imaging systems.
The greatest advantage for researchers is the reduction in analysis time through intuitive and simple operations, enabling the rapid creation of high-definition output data suitable for scientific papers.
Basic Data Processing: Streamlining Noise Reduction and Data Correction

Accurate optical mapping data analysis requires appropriate signal processing steps, including data masking, spatial and temporal filtering, and baseline drift removal. It is crucial to be cautious, as improper filtering can distort signal upstroke times and activation times, potentially leading to erroneous physiological interpretations.
BV Workbench is equipped with various noise reduction filters and data correction functions to achieve a high signal-to-noise (S/N) ratio.
-
Data Masking:
This specifies the area for data analysis. When there is a clear difference in light intensity, the "Add mask" function can be used.
Otherwise, the polygonal ROI (Region of Interest) function is used to separate pixels on the tissue from the background. -
Spatial/Temporal Filters:
These are used to remove noise. Available spatial filters include Gaussian and mean filters, while temporal filters include FIR, Savitzky-Golay, and moving average filters. -
Automation:
BV Workbench includes a feature for the automatic optimization of peak detection and filter/map settings to streamline analysis (though manual adjustment by the user is also possible) -
Drift Removal and Normalization:
The software can also perform correction for baseline drift caused by factors like photobleaching and normalization to compensate for amplitude differences in light intensity between pixels.
The cardiac mapping data processing and analysis using BV Workbench are conducted in line with the review on optical mapping data analysis methods by Laughner et al. (Am J Physiol Heart Circ Physiol. 2012).
Rapid Creation of Activation Maps
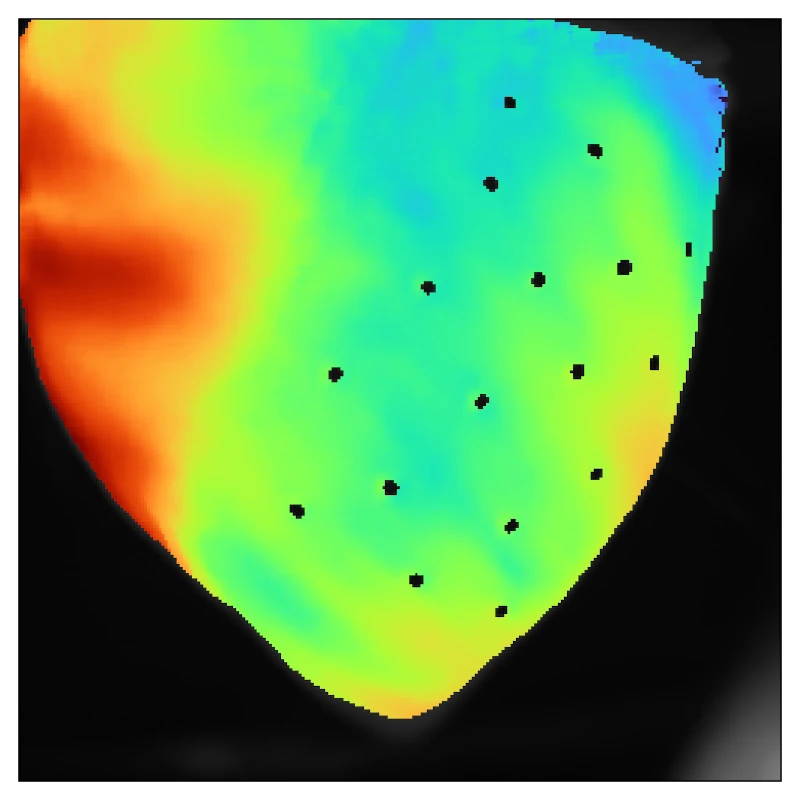
An Activation Map is essential for visualizing the pathway and velocity of cardiac excitation as it propagates through the tissue over time.
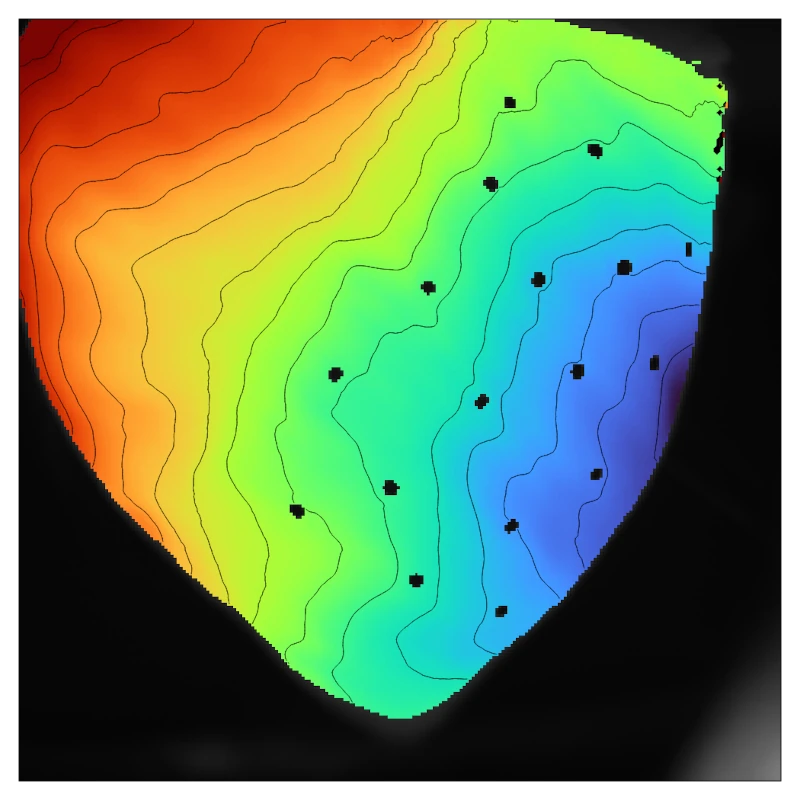
Activation map
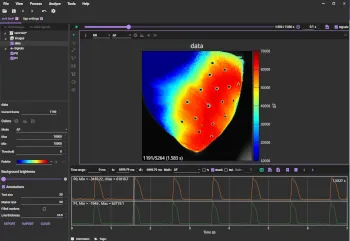
In BV Workbench, an Activation Map can be easily created by selecting [Time domain analysis] from the [Analyze] menu.
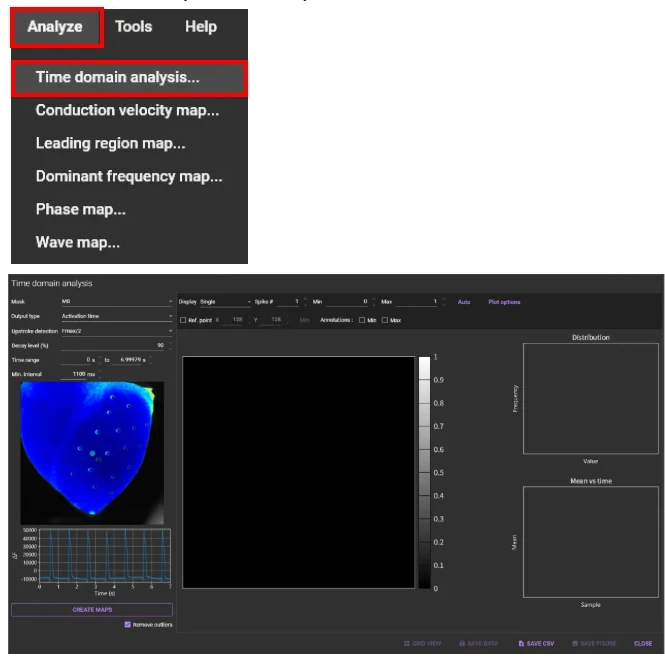
Time domain analysis dialog
The procedure for creating an Activation Map is as follows:
-
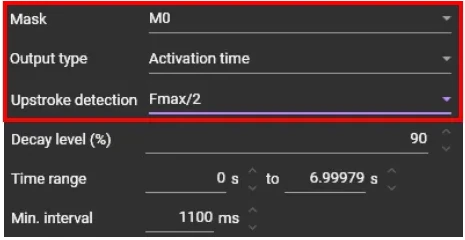
1. Select Output Type and Detection Criteria:
Choose "Activation time" as the output type and select the criterion to define the excitation time (e.g., "Fmax/2" or "max(dF/dt)"). Conventionally, activation time is defined as the point of the OAP's maximum upstroke velocity (dF/dt max).
-
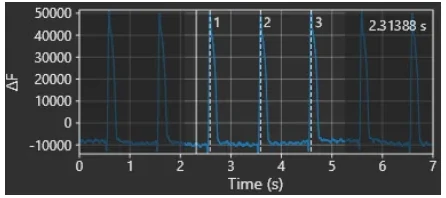
2. Automatic Peak Detection:
Clicking [CREATE MAPS] automatically detects and numbers the peaks of the action potentials (or Ca²+ transients).

If detection is insufficient, adjusting the "Min. interval" (the minimum time interval between two peaks) and re-running the process can ensure accurate peak detection.
-
3. Set a Reference Point:
When comparing maps corresponding to multiple peaks (heartbeats) on the same color scale, click [Ref. point] to set a reference point (the pixel where activation time is 0 msec).
The [Min] function, which automatically sets the reference point to the pixel with the minimum value, is also available to improve the comparability between maps.
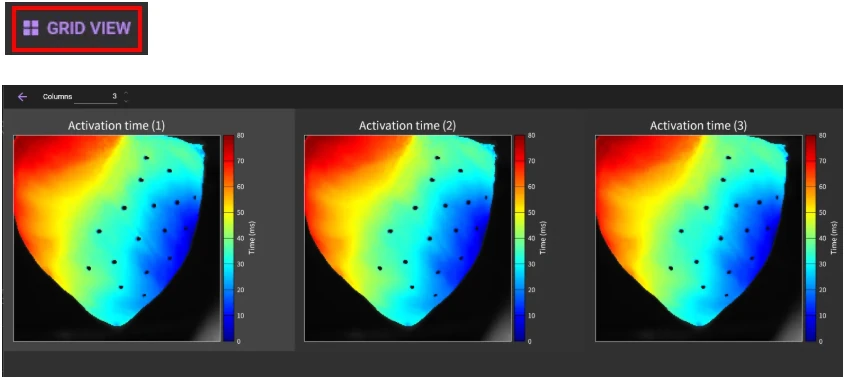
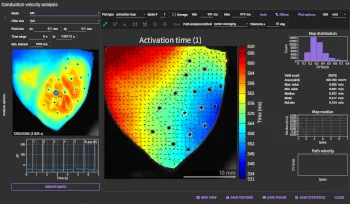
The created "Activation time map" can be viewed as a list of maps corresponding to each peak (heartbeat) by clicking [GRID VIEW].
Analysis of Repolarization Properties with APD Maps
An APD (Action Potential Duration) Map is an indispensable tool for analyzing the spatial heterogeneity of repolarization in myocardial tissue.
APD map
A key advantage of optical mapping over electrode array recordings is its ability to study repolarization properties (APD).
APD is defined as the duration from the activation time (t_act) to the time when repolarization is complete (e.g., APD50 for 50% repolarization, APD80 for 80% repolarization).
APD map displays the spatial distribution of these APD values, visualizing repolarization gradients between the apex and base or endocardium and epicardium of the heart, as well as spatial heterogeneity (APD dispersion), which is considered important in arrhythmogenesis.
BV Workbench supports the creation of Repolarization maps in the same way as Activation Maps. Furthermore, it includes a function to calculate the mean and standard deviation from multiple peaks for various waveform analysis parameters such as APDxx, Upstroke Velocity, and Alternans, and to export the results in CSV format.
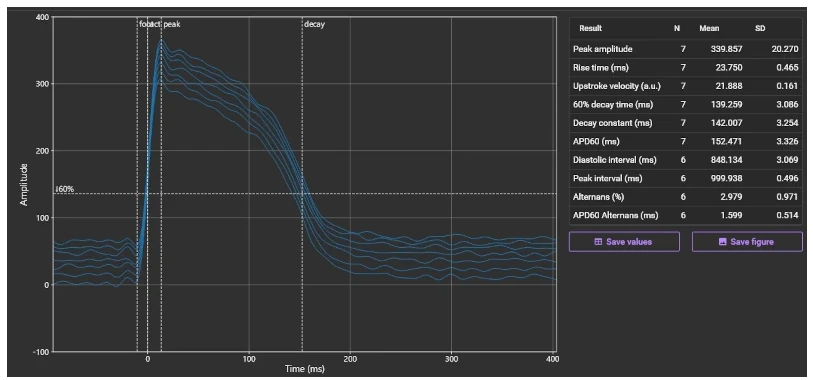
Waveform analysis
- Peak amplitude
- Rise time
- Upstroke velocity
- xx% decay time
- Decay constant
- APDxx
- Diastolic interval
- Peak interval
- Alternans
- APDxx Alternans
Drift removal is essential for the accurate calculation of APD and repolarization times. The presence of baseline drift can lead to inaccurate calculations of Activation time, CV, and APD.
Conclusion: Accelerating Research and Creating High-Quality Figures
BV Workbench Ver. 4 is designed to provide an integrated and rapid workflow for cardiac optical mapping data analysis, from pre-processing to the creation of key electrophysiological maps such as Activation Maps, APD Maps, Conduction Velocity Maps, and Phase Maps.
Researchers can reduce analysis time while exporting map data and images in high resolution as PNG files (suitable for high-quality printing) or SVG files (vector graphics editable in software like Adobe Illustrator), allowing for the swift creation of high-quality figures for papers and conference presentations.
BV Workbench strongly supports advanced analysis even for researchers new to the process, through features like automatic setting of optimal values and technical support via email.
A 3-month free trial is currently available. We encourage you to consider introducing BV Workbench to enhance the efficiency and quality of your cardiac electrophysiology research.
Product information
- Analysis Software for Optical Mapping and Calcium Imaging
- BV Workbench
BV Workbench Ver.4 is the latest version of data analysis
software developed for optical mapping and calcium imaging of
the brain and heart.
In addition to data files
acquired with Brainvision's MiCAM imaging system, it is also
possible to open 16-bit TIFF files acquired with cameras and
imaging systems from other companies.
- High Speed Imaging System
- MiCAM03-N256
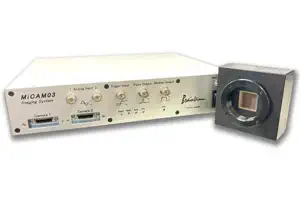
MiCAM03-N256 is a high-speed imaging system that captures and visualizes small changes in fluorescence intensity from biological samples stained with fluorescent probes, such as voltage sensitive dyes and calcium dyes.
- Spatial Resolution :
-
128x128 - 256x256 pixles
(32x32 pixels - 256x256 pixles with option) - Maximum Frame Rate :
- 1,000fps
(20,000 fps available with option) - Up to 2 camera heads can be used with completely synchronization.