Spatio-temporal plot
Right click on a line or polyline and select [Spatio-Temporal plot...]. A spatio-temporal map showing specified line (pixels) on vertical axis and time on horizontal axis is displayed, and temporal change in light intensity of pixels on line is shown in pseudo color.
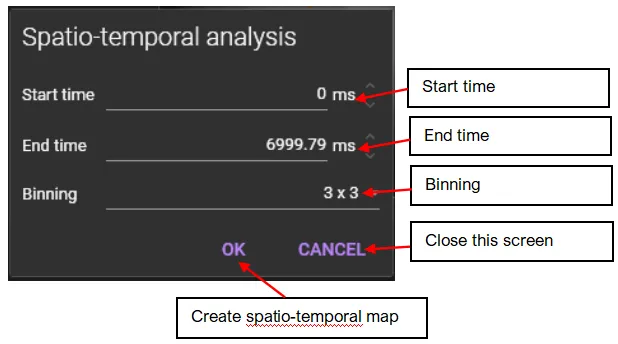
If “invalid scale” error message appears on the screen, right-click on the line and select “Set scale”. Enter length of the line.

Analysis results are displayed.
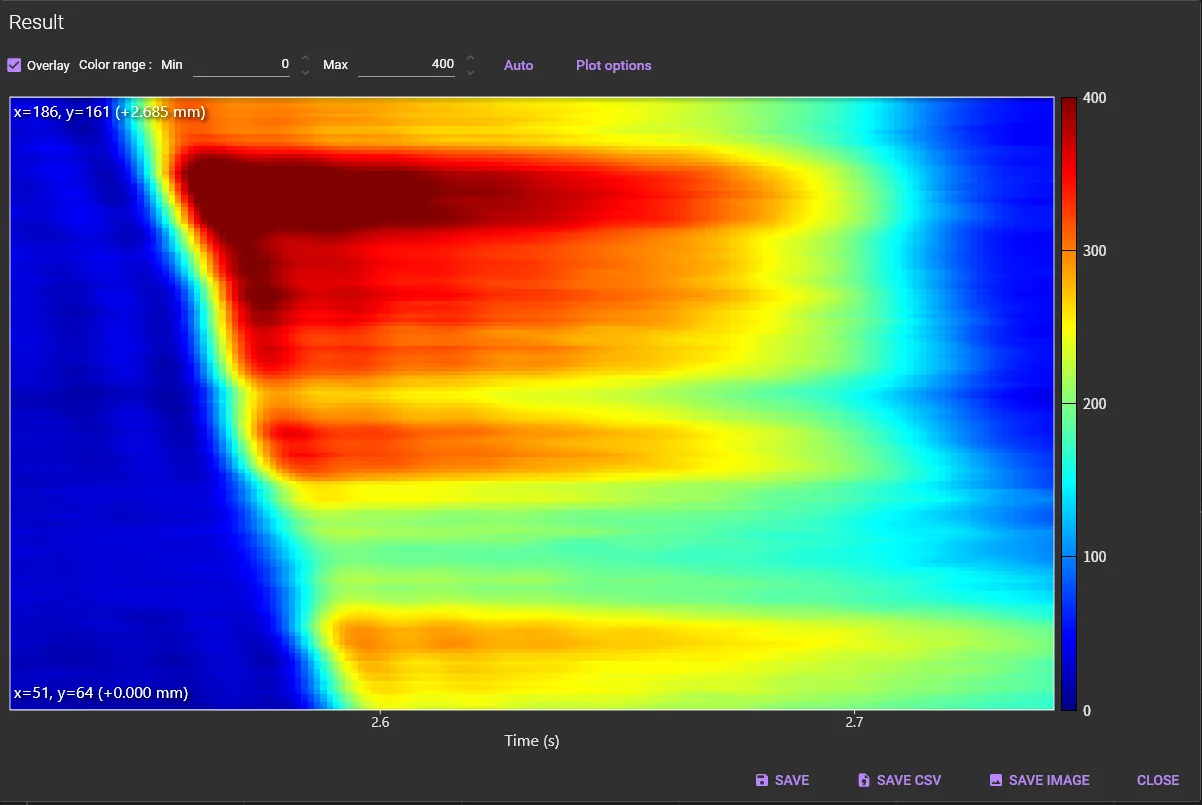
The following mouse operation is possible on the plot.
| Operation | Description | |
|---|---|---|
| Scroll mouse wheel | Enlarge/reduce map size | |

(1) Overlay
If checked, the coordinate information will be displayed on the image.
(2)(3) Color range: Min / Max
Specifies the minimum and maximum values for the color display range.
(4) Auto adjustment
Click to set the color display range to the optimum values.
(5) Plot options
Click to open color map setting screen. Color map (palette) can be changed.


(6) SAVE
Click to save data in a binary file (*.dat).
(7) SAVE CSV
Click to save data in a CSV file (*.csv).
(8) SAVE IMAGE
Click to open “Figure editor”. See “Save image (figure editor)” for details.
(9) CLOSE
Click to close this window.